Fall 2011 - Vol.6, No.3
Predictors of Emergency Department Super-Utilizers
Michael A. Horst, PhD, MPHS, MS
Lancaster General Research Institute
Jeffrey R. Martin, MD
Lancaster General Family Practice Residency
Angela S. Gambler, MBA
Lancaster General Research Institute
Andrew S. Coco, MD, MPH
Lancaster General Research Institute
Lancaster General Family Practice Residency
|
 |
 |
 |
 |
| |
ABSTRACT
Healthcare spending continues to rise and it is important to determine the factors associated with individuals who are super utilizers (SUs) of healthcare resources.
We designed a pilot study to identify the primary predictors of high ED or inpatient utilization in a population of primary care patients. A second objective was to define the magnitude and impact of high ED or inpatient utilization in a population of primary care patients by determining the proportion of patients who are SUs, the frequency of their visits, and the magnitude of the charges they incur.
This retrospective cohort study was carried out in primary care offices (family practice, pediatrics and internal medicine) and the emergency department within the Lancaster General Health system in Lancaster County, PA. All visits were included; super utilizers were defined as ≥ the top 10th percentile in number of visits.
For subjects associated with a primary care practice, factors associated with EDSUs included higher volumes of inpatient and primary care visits, age 18-39, commercial, medicare or other payer status, and shorter travel times to Lancaster General and other ED facilities. Factors associated with inpatient SUs included male gender, higher volumes of ED and primary care visits, age 65+, commercial payer status and shorter travel times to Lancaster General and other hospitals.
Conclusions: For super utilizers affiliated with a primary care site within the health system, there are different predictors for ED vs. inpatient services. Results are being used to conduct a larger study as well as a pilot intervention in a primary care practice.
BACKGROUND
Healthcare spending continues to climb, reaching approximately 17.6% of the US GDP in 2009.1 It is estimated that 5% of the population accounts for almost 50% of all healthcare spending. Emergency department super-utilizers (EDSUs) are individuals who excessively use healthcare services in emergency departments, thus increasing costs and resource allocation. We became interested in assessing the impact of these super-utilizers at Lancaster General after hearing about the work of and visiting Jeffrey Brenner, MD (Camden Coalition of Healthcare Providers: see http://www.camdenhealth.org/) to learn about what he has done in Camden, NJ.2,3 The impetus for studying SUs is the recent emphasis upon healthcare reform, Accountable Care Organizations, Population Health Management and other structures to reduce costs. Factors from other studies that seemed predictive of frequent ED utilization include: demographics (age, gender and race/ethnicity), socio-economic status (education, payer type, income level, single parent household, homelessness), health status (poor mental health, substance abuse, psycho-social issues) and previous health service utilization.4,5,6,7,8,9,10,11,12,13,14,15
Frequent ED utilizers have been defined in several different ways, such as the ratio of ED visits to the combined total of ED and primary care visits;4 those individuals who comprise the combined total of 25% of ED visits or charges;8 or those who exceed expected utilization rates (calculated by multivariate modeling).6 In a majority of studies, the classification of ED frequent utilizers was based on the distribution of visits per time unit - either in the data set for which they were conducting the analyses and/or criteria from other studies.6,7,9,10,11,12,13,14,15 Frequent utilizers generally ranged from 4 to 12 ED visits per time unit (often 12 months).
We collected baseline data in our health system to develop a grant proposal to reduce super utilization rates in Downtown Family Medicine. We sought to define predictors of SUs across the Lancaster General system, and specifically to answer the following questions for a population of primary care patients:
- What is the magnitude and impact of high ED or inpatient utilization?
- What are the primary predictors of high ED or inpatient utilization?
METHODS
Study Subjects
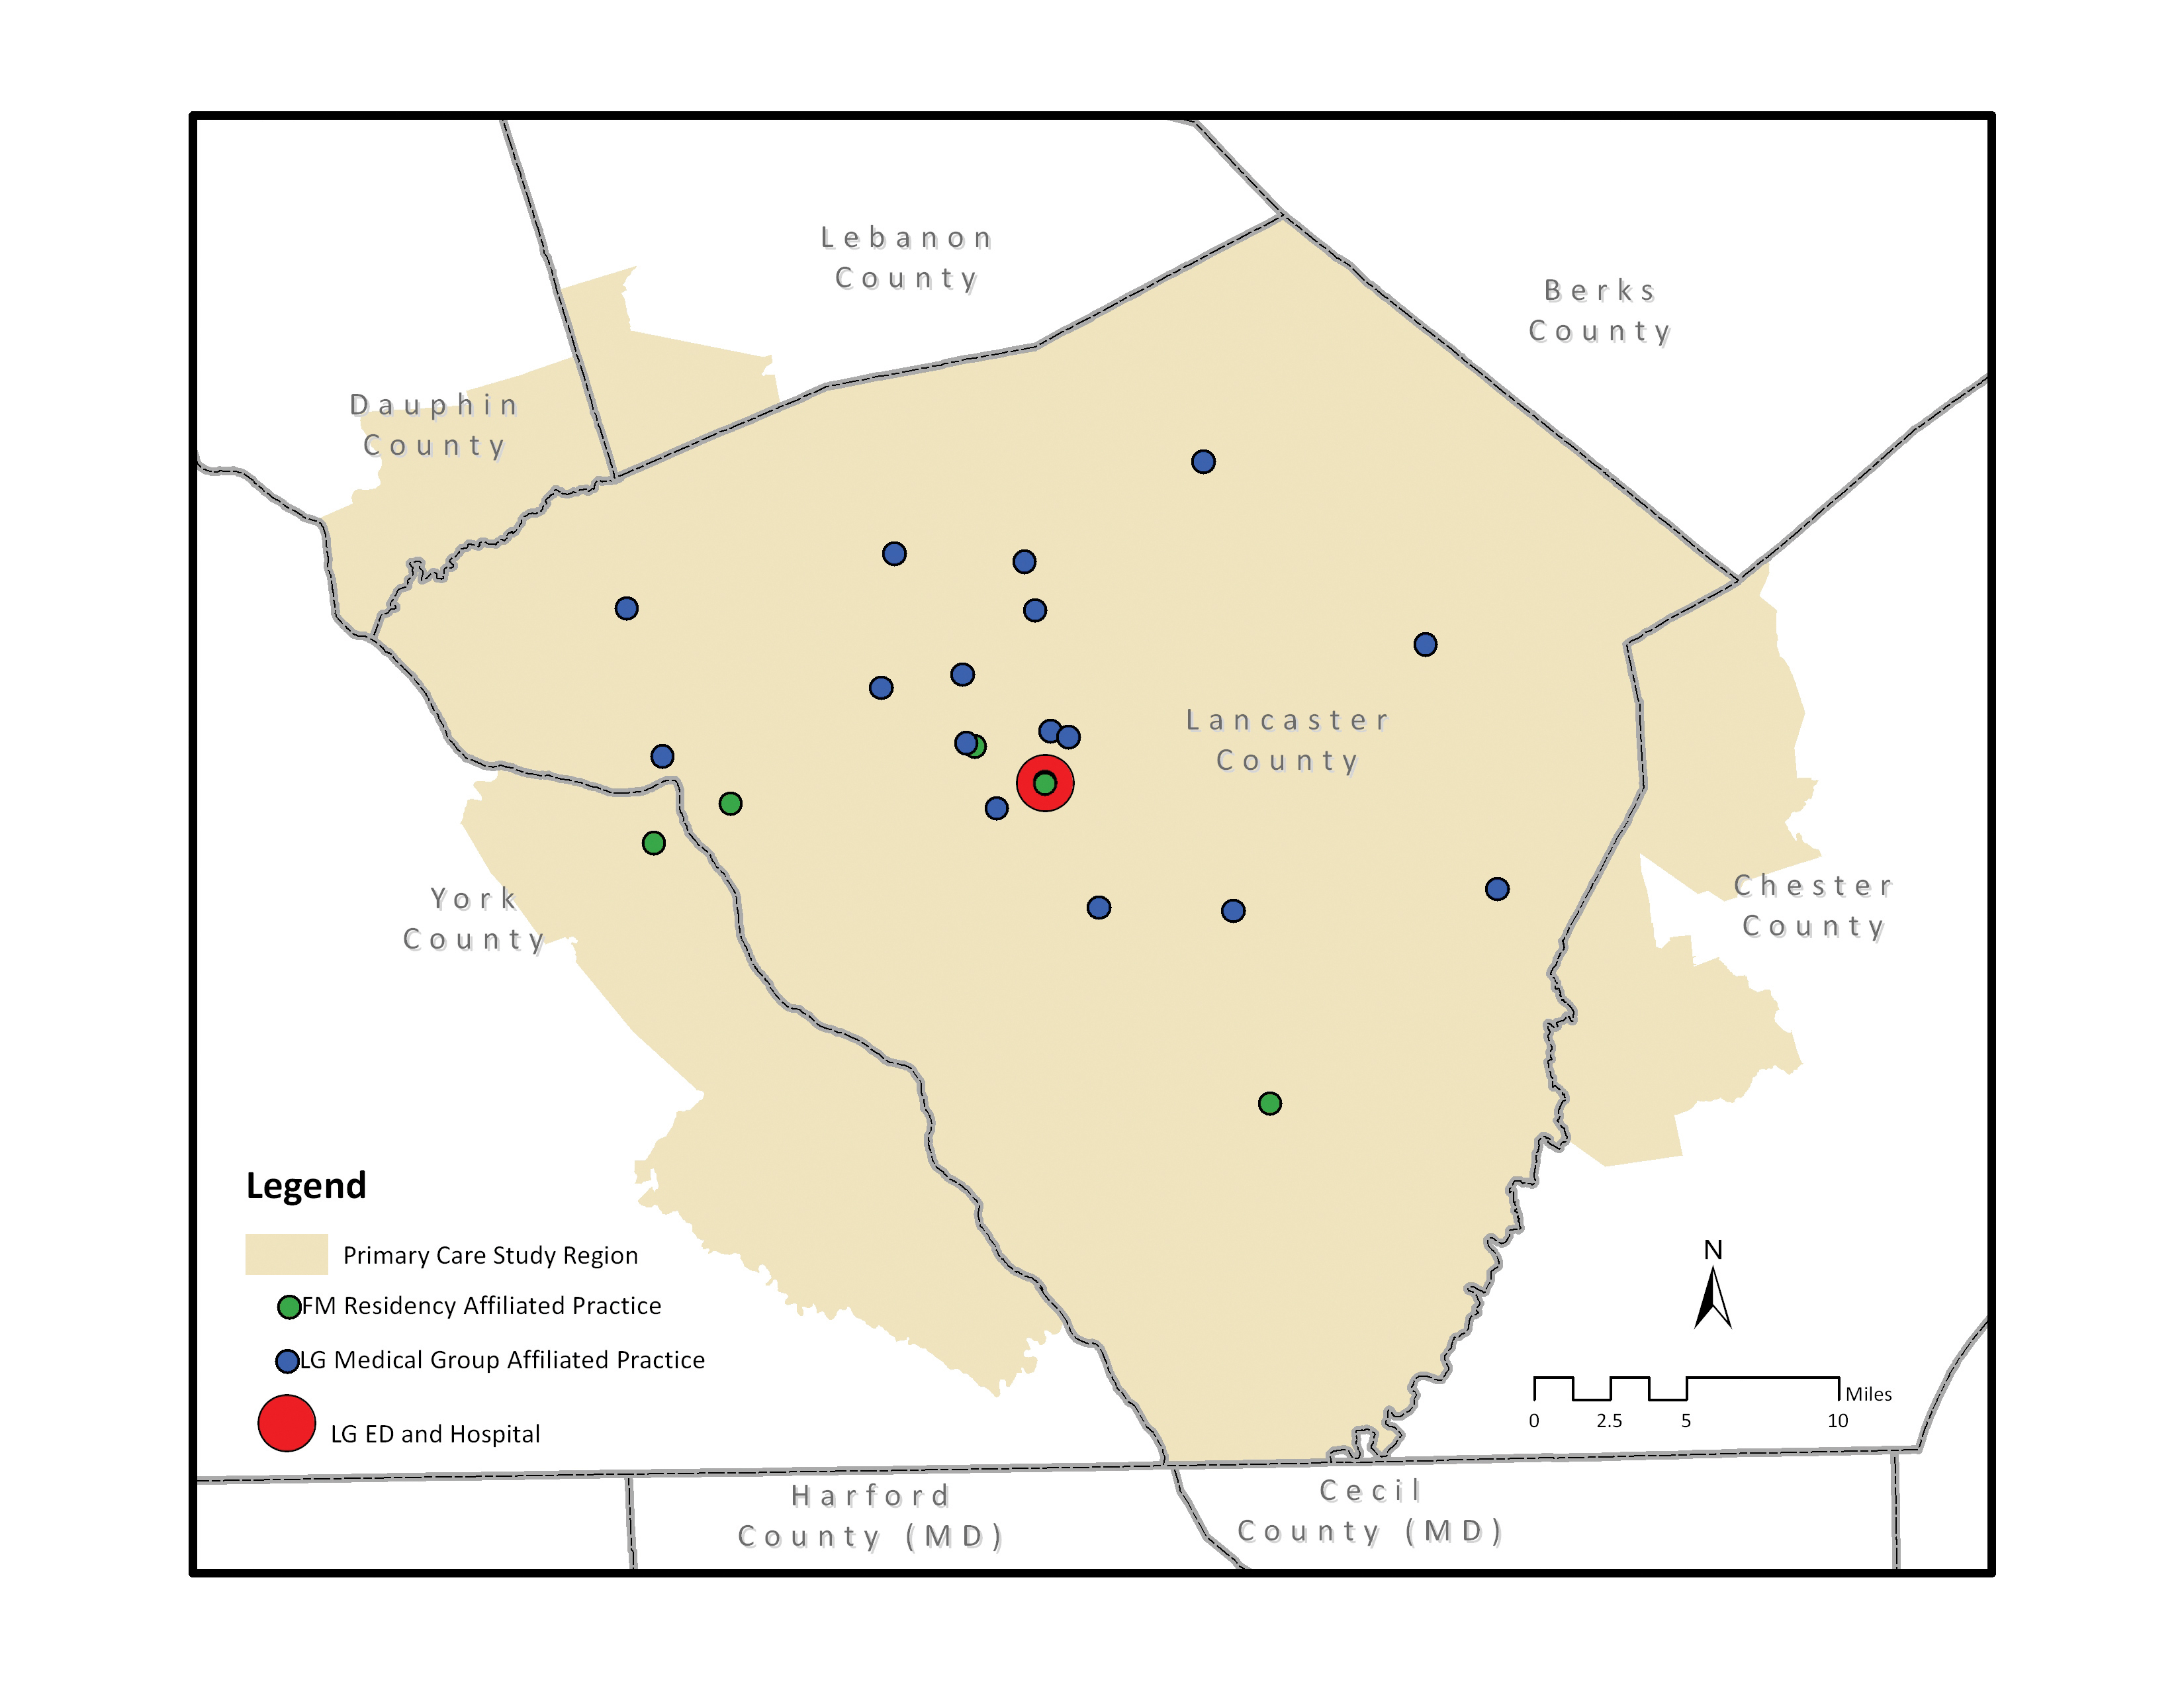
Subjects for this study were all patients during calendar year 2008-2009 visiting a Lancaster General primary care practice which includes Lancaster General Medical Group and the Family Practice Residency Program affiliated practices. Unique subjects were categorized as being in a single primary care practice or multiple practices (visiting more than one practice during the study time frame). Encounters with other health systems were not captured and individuals with no encounters within the Lancaster General primary care network were excluded. We included subjects only if they could be geocoded to a rooftop or street address within a pre-defined geographic area where the majority of visits were generated. This geography and methodology was defined in a previous study using a similar data set from the same practices (Figure 1).16
ANALYSIS
One additional variable was calculated as a predictor of super utilization: travel time to Lancaster General ED/Hospital as well as travel time to ED/hospitals in Lancaster and surrounding counties. This was done to help adjust for the likelihood that a subject would come to the Lancaster General facility vs. another facility due to greater proximity to the home address. To calculate travel time, road network data files with segment distance and speed limits were used to weight the travel time in successive 5-minute increments from each healthcare facility. Each subject residence was coded with the travel time to Lancaster General as well as other health facilities. We conducted descriptive analyses of data outlining the demographics and univariate associations with each predictor for super utilizers for both the ED and inpatient settings. To determine predictors of high utilization: we constructed two binary random-intercept models predicting membership in the super utilizer group for both the ED and inpatient settings with primary care practice as the random intercept. Analyses were conducted using Minitab 16 (State College, PA), Stata 11 (College Station, TX) and ArcView (Redlands, CA). This study was approved by the Lancaster General Hospital Institutional Review Board with a waiver of consent.
Figure 1. Study Area
We identified individuals as super utilizers of ED, inpatient or primary care services if they were ≥ 90th percentile (i.e. in the top 10th percentile) in number of visits during the 2-year study time frame. There were a total of 151,898 unique individuals meeting the inclusion criteria representing a total of 1,370,917 primary care visits, 52,426 ED visits and 28,422 inpatient visits (Table 1) during the 2 year study period.
Table 1. Target Area Primary Care (geocoded to street or rooftop), Inpatient and ED Visits from 1/1/2008-12/31/2009

Note: Mean, SD, Min, Median and Max are calculated per unique individual over the 2 year study time frame. For ED and Inpatient, it is calculated only for those having visits in those areas.
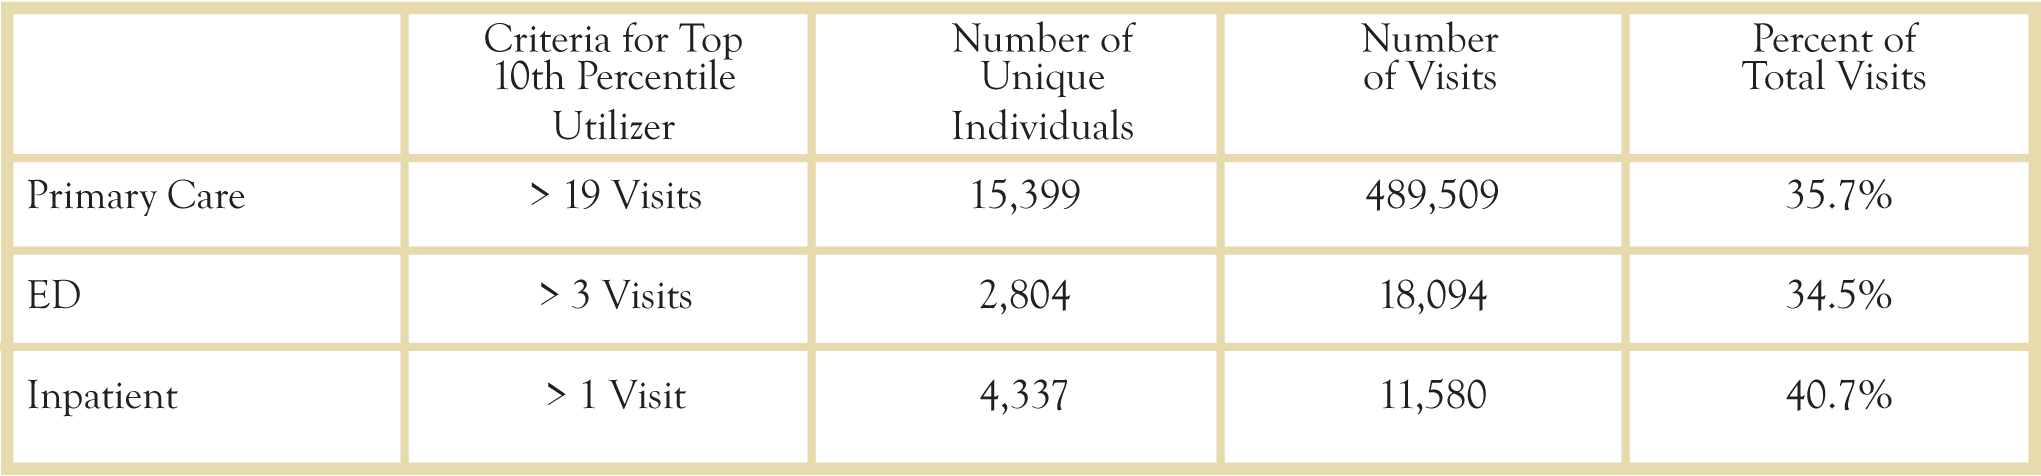
Table 2 outlines the criteria, number of unique individuals, visits, and the percentage of all visits within the primary care, ED and inpatient settings. Of the 6,761 (4.5% of all subjects) individuals identified as a top ED or inpatient utilizer, 380 (5.6%) subjects were in both groups (0.25% of all subjects).
Table 2. Top 10th Percentile Utilizers
Results
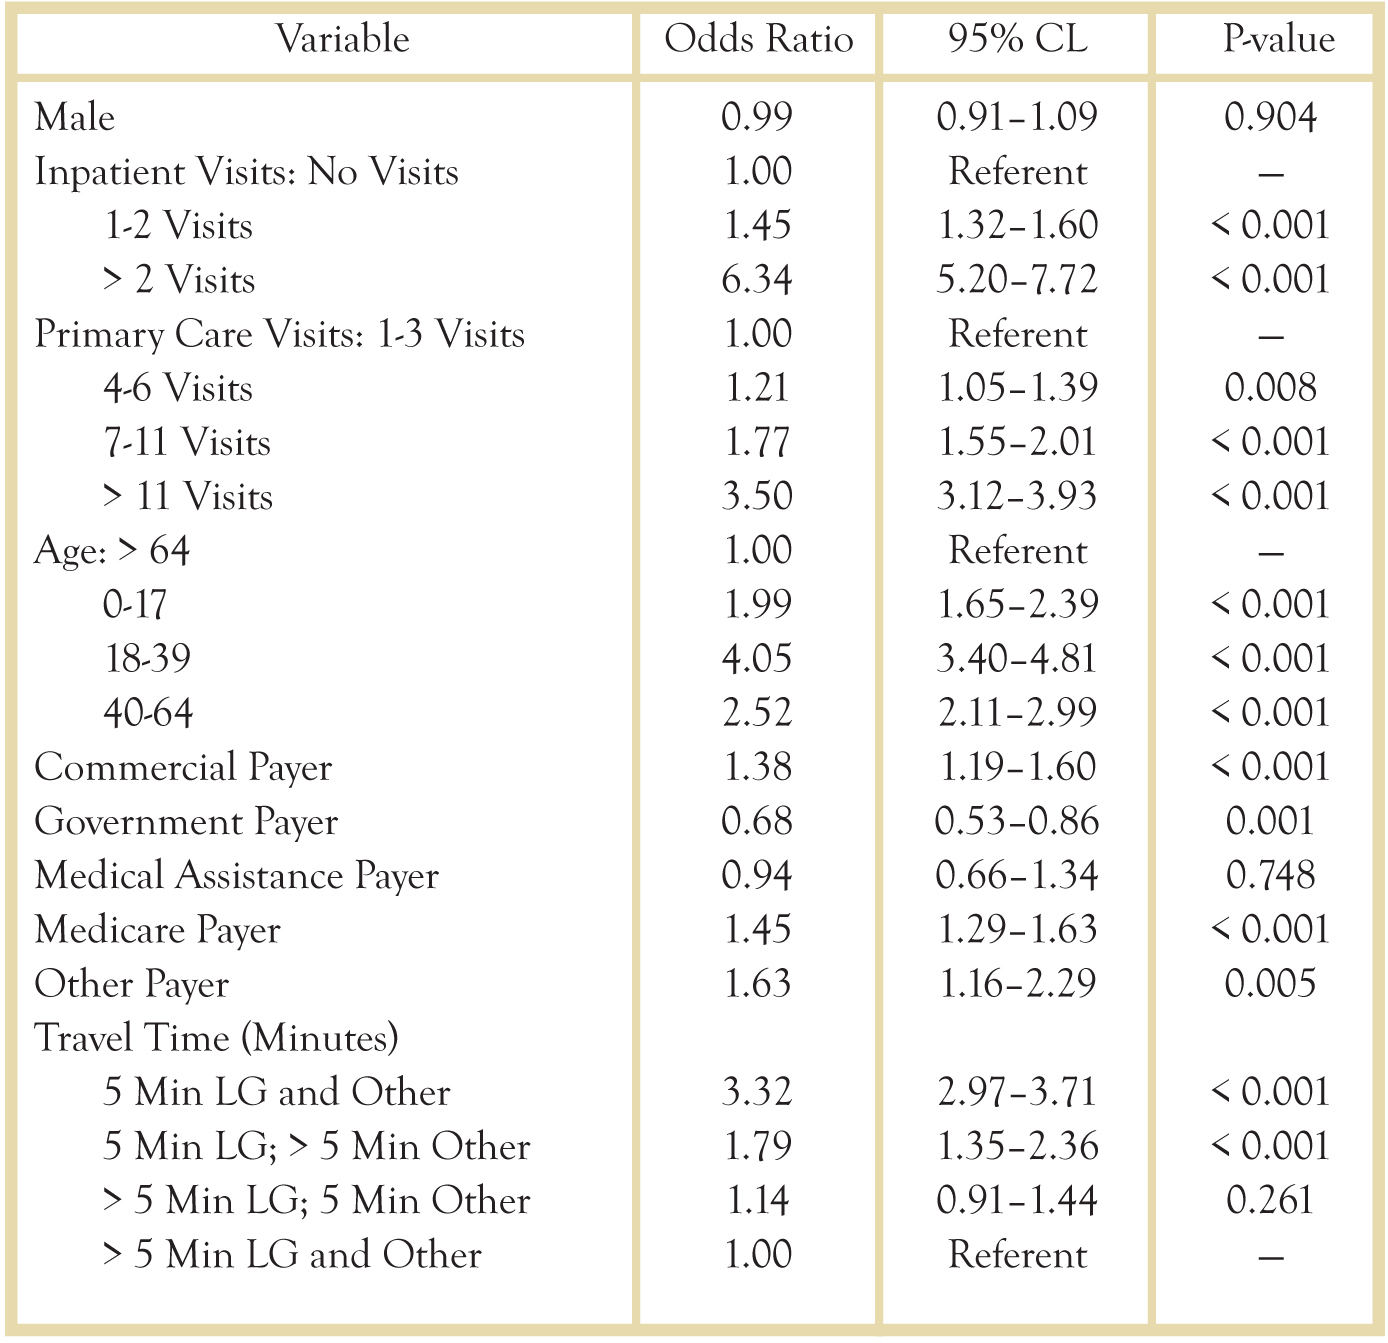
For subjects associated with a primary care practice, factors associated with super utilizer status included higher volumes of inpatient and primary care visits, age 18-39, commercial, medicare or other payer status and shorter travel times to Lancaster General and other ED facilities (Table 3).
Table 3. Factors Associated with High ED Utilizers (>= 90th Percentile): Binary Random Intercept Model with Primary Care Practice as the Random Intercept
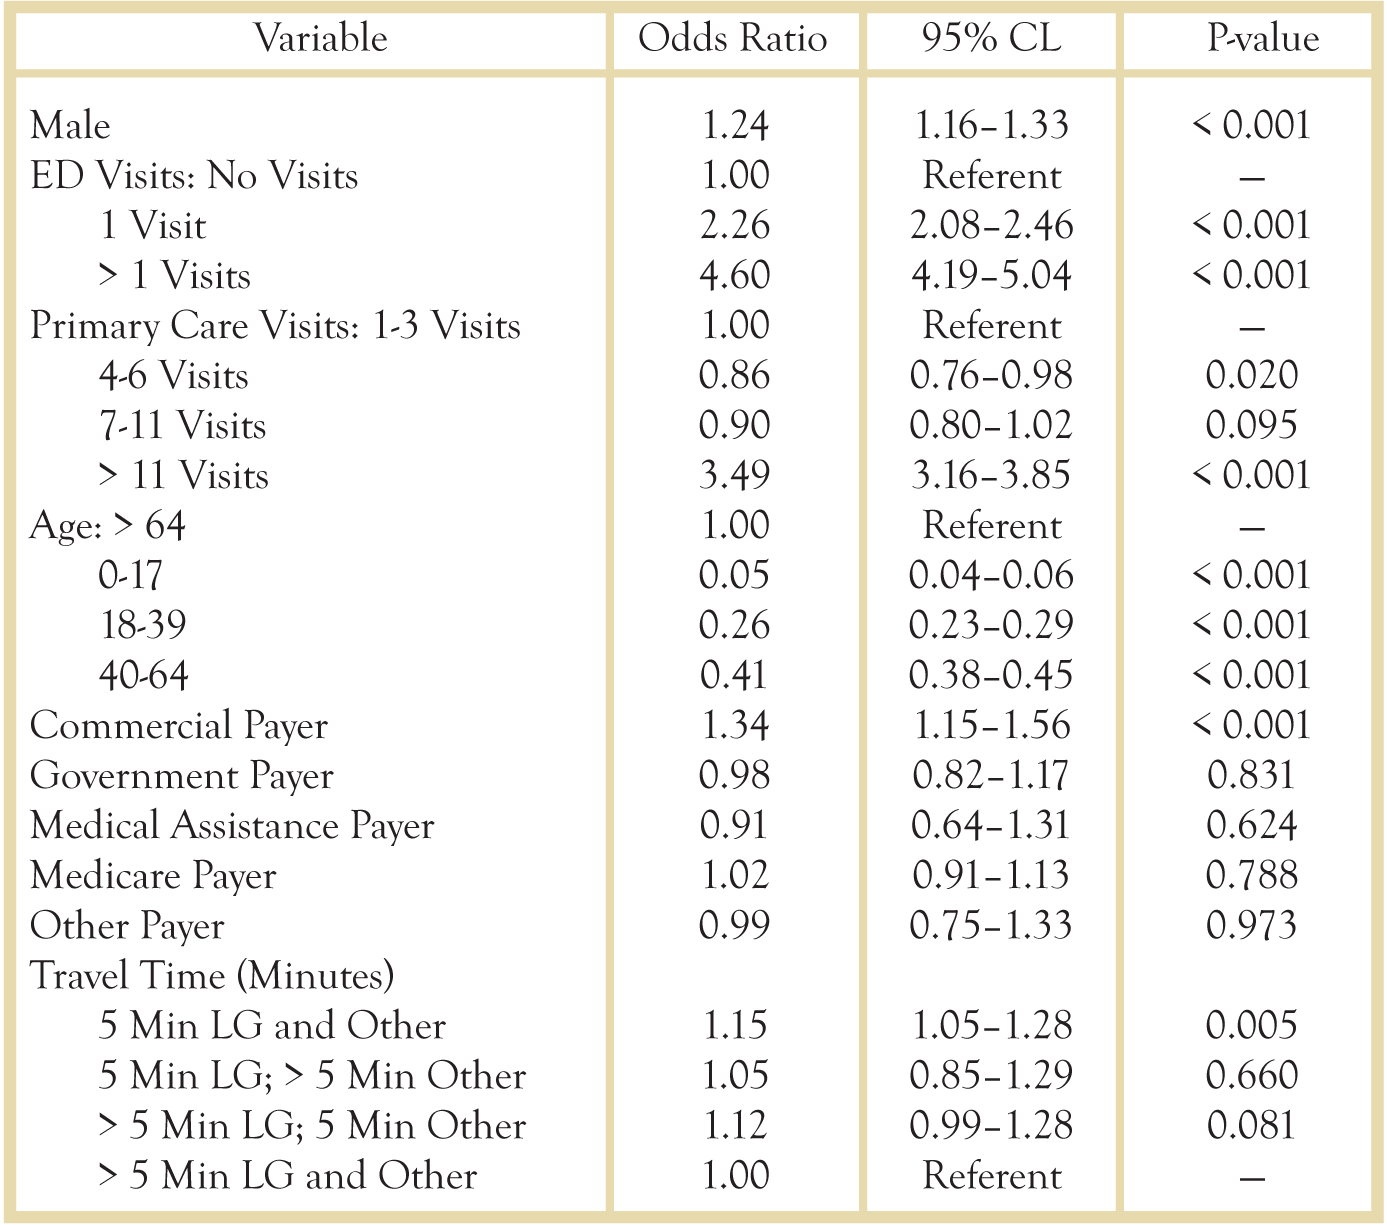
In contrast with factors for ED super utilizers, factors associated with inpatient super utilizers included not only higher volumes of ED and primary care visits, but male gender, age 65+, commercial payer status, and shorter travel times to Lancaster General and other hospitals (Table 4).
Table 4. Factors Associated with High Inpatient Utilizers (≥ 90th Percentile)*
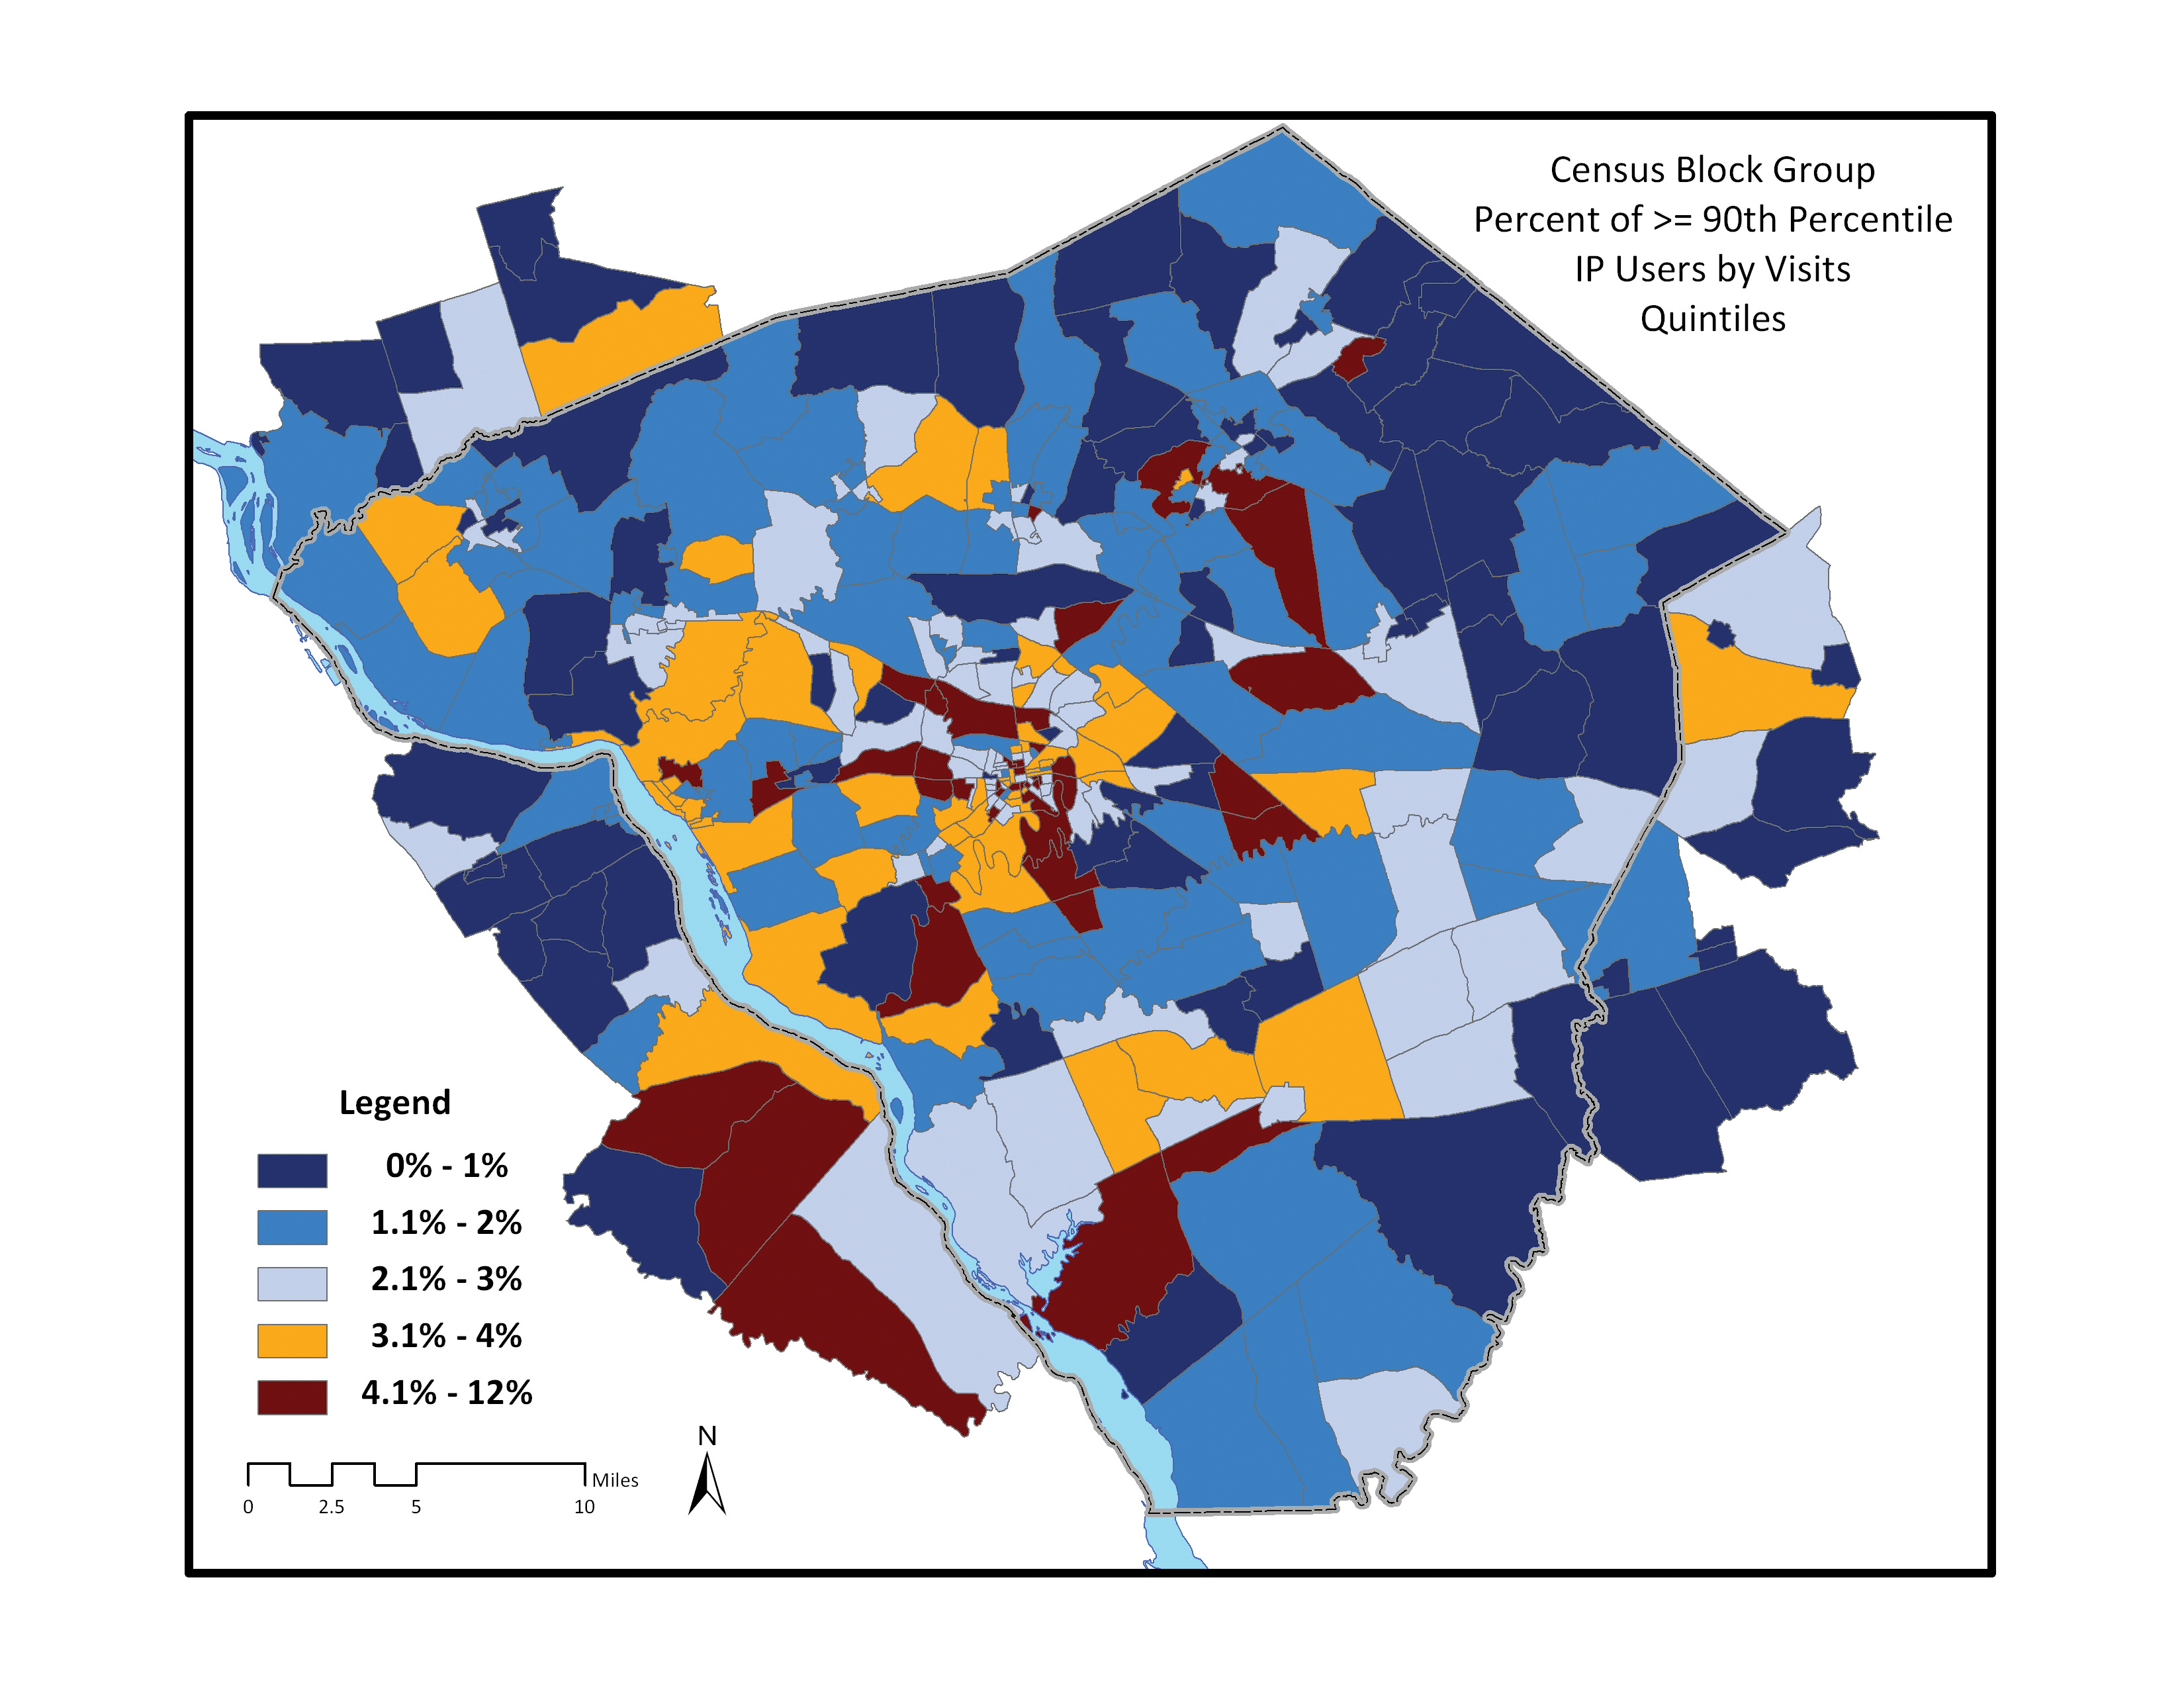
We mapped the percentage of super utilizers by census block group in the study area and found that the highest concentration of ED super utilizers was in the region immediately surrounding Lancaster City. Concentrations of inpatient super utilizers were scattered across the study region in a more random pattern. (Figs. 2 and 3).
Figure 2. Percentage of ED Super Utilizers by Census Block Group Organized by Quintiles
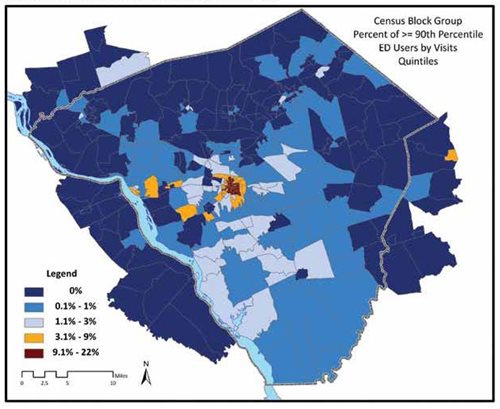
Figure 3. Percentage of Inpatient Super Utilizers by Census Block Group Organized by Quintiles
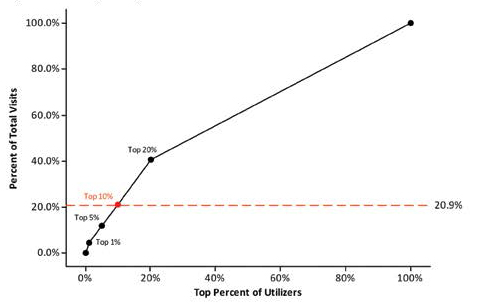
We then estimated the association between the percentile of utilization for each subject and the cumulative percent of total visits consumed, to determine the overall demand upon system resources by various tiers of utilizers. As was stated in Table 2, the ED super utilizer group (top 10th percentile) consumed 34.5% of the total ED visits by all subjects during the 2 year study time frame. Figure 4 shows the percentage of visits consumed by the top 1%, 5%, 10%, 20% and 35% (with the super utilizer designation point and reference line in red). Thus the top 1% and 5% utilizers consumed 8.4% and 20.6% respectively of the total ED visits by all subjects during the 2 year study time frame. For inpatients, the super utilizer group (top 10th percentile) consumed 20.9% of the total inpatient visits by all subjects during the 2 year study time frame (Table 2). Figure 5 shows the percentage of visits consumed by the top 1%, 5%, 10% and 20% (with the super utilizer designation point and reference line in red). Thus the top 1% and 5% utilizers consumed 4.5% and 11.7% respectively of the total inpatient visits by all subjects during the 2 year study time frame.
Figure 4. Percent of ED Top Utilizers and Cumulative Percent of Visits
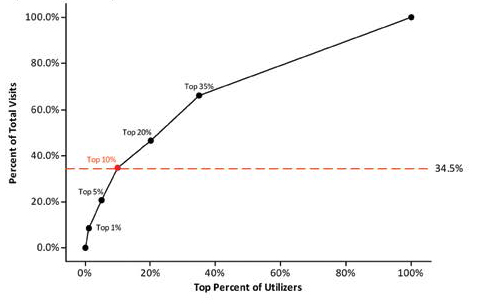
Figure 5. Percent of Inpatient Top Utilizers and Cumulative Percent of Visits
DISCUSSION
Our preliminary analysis suggests that for subjects affiliated with a primary care site within the health system, there are differences in the characteristics of super utilizers of ED and inpatient services. EDSUs are younger and are generally clustered in areas with shorter travel times to the hospital/ED than inpatient SUs. These results match previous studies of EDSUs which identified younger adults as having a higher likelihood of being a super utilizer.7,10,14 We hypothesize that older inpatient SUs are those with multiple comorbidities and complications, unlike the younger EDSUs who may have more social needs and who use the ED as a primary care site. Elderly subjects across the health system are more likely to live in retirement communities scattered further from the downtown area. This phenomenon may explain the random distribution of inpatient SUs vs. the concentration of EDSUs super utilizers in the downtown Lancaster City region.
Within these groups of subjects who are affiliated with a primary care site, we found that both ED and inpatient super utilizers were more likely to have high levels of additional healthcare encounters (other primary care, ED or inpatient). These results are similar to those of several other studies which found associations with ED super utilizers and high utilization of other types of healthcare services.8,9,10,12,13,15 We found mixed results with payer status, though we coded payer status for each subject if they had any visit with a payer type. Thus, if a subject had visits using multiple payer types they would have appeared in multiple payer categories. This inability to directly classify subjects by payer type is a limitation of the study, but it is a reality of a longitudinal study where individuals may have multiple encounters and status changes.
We were surprised that subjects with Medicaid were not more likely to be ED or inpatient SUs; other studies have indicated that poverty and medical assistance programs were predictors of ED super utilization.4,7,8,9,10,11,12,14 In this study, we only focused upon individuals affiliated with a primary care practice, which may suggest that if an individual is on Medicaid, having the primary care affiliation may help to prevent them from becoming a super utilizer. For inpatient super utilizers, only a commercial payer was associated with super utilization whereas for EDSUs, commercial, Medicare and other (includes self-insured or non-insured) were associated with higher utilization.
LIMITATIONS
There were many limitations in the study design and data. We did not extract clinical variables to determine comorbidities or health status to further identify individuals that may be SUs for clinical or other reasons. We also did not extract diagnoses of mental health-related issues which was identified as a key variable in other studies.7,8,13,14 As a follow up to this pilot, we are conducting a larger study where we are defining comorbidities through validated comorbidity scores and ICD9 codes as well as identifying subjects as having a mental health-related diagnosis.
This study did not include individuals who may have been SUs but did not have visits to any of the Lancaster General Health primary care sites. These individuals will be included in the follow up study so that we can compare differences between the two groups, though we will not be able to conclusively determine for those not visiting a Lancaster General primary care site whether this is because they go to one outside our health system or do not have any primary care site home. This study did not include any data relative to ED visits to determine if access to a primary care site would have been an alternative. In subsequent analyses, we will include the time and date of ED visits as well as method of arrival to help determine if ED visits occurred during normal primary care visit hours. We did not include any individual variables other than payer status to indicate socio-economic or social support factors. These data are limited in clinical and billing records, but in our follow-up study, we plan to interpolate some of these data elements from US Census Bureau estimates for regions where individuals reside.
ENDNOTE
Since completion of this pilot study, we have initiated a larger and more formal study to look at some of these additional variables and subjects across the Lancaster General system. In addition, we have initiated, through a grant from the Lancaster General Foundation, a pilot-project to case-manage a small subset of inpatient SUs from one of the primary care practices with high inpatient SU rates. Our goal is to assess the ability of targeted interventions to reduce healthcare utilization among this population. Results from this analysis and our continued work will help define characteristics associated with super utilization as well as provide a framework for outcome assessment.
RESOURCES
1. Understanding US Health Care Spending. National Institute for Health Care Management, Washington, DC. July 2011.
2. Brenner J. Building an accountable care organization in Camden, NJ. Prescriptions for Excellence in Healthcare 2010;9:6-8.
3. Gawande A. The hot spotters: Can we lower medical costs by giving the neediest patients better care? The New Yorker 2011;January 24:41-51.
4. Kroner E. et. al. Emergency department reliance: A discriminatory measure of frequent emergency department users. Pediatrics 2010;125:133-138.
5. LaCalle E. et. al. Frequent users of emergency departments: The myths, the data and the policy implications. Ann Emerg Med 2010;56:42-48.
6. Locker T. et. al. Defining frequent use of an urban emergency department. Emerg Med J 2007;24:398-401.
7. Fuda K. et. al. Frequent users of Massachusetts emergency departments: A statewide analysis. Ann Emerg Med 2006;48:9-16.
8. Hunt K. et. al. Characteristics of frequent users of emergency departments. Ann Emerg Med 2006;48:1-8.
9. Pines J. et. al. Predictors of frequent emergency department utilization in southeastern Pennsylvania. J Asthma 2006;43:219-223.
10. Blank F. et. al. A descriptive study of heavy emergency department users at an academic emergency department reveals heavy ED users have better access to care than average users. J Emerg Nurs 2005;31:139-144.
11. Ruger J. et. al. Analysis of costs, length of stay and utilization of emergency department services by frequent users: Implications for health policy. Acad Emerg Med 2004;11(12):1311-1317.
12. Zuckerman S. et. al. Characteristics of occasional and frequent emergency department users. Med Care 2004; 42:176-182.
13. Sun B. et. al. Predictors and outcomes of frequent emergency department users. Acad Emerg Med 2003;10(4): 320-328.
14. Mandelberg J. et. al. Epidemiologic analysis of an urban, public emergency department's frequent users. Acad Emerg Med 2000;7(6):637-646.
15. Rask K. et. al. Ambulatory health care use by patients in a public hospital emergency department. J Gen Intern Med 1998;13:614-620.
16. Horst M, Coco A. Observing the spread of common illnesses through a community: Using Geographic Information Systems (GIS) for surveillance. J Am Board Fam Med 2010;23:32– 41