 Click to Print Adobe PDF
Fall 2010 - Vol.5, No.3
The Spread of the H1N1 Outbreak in the Lancaster Community
Michael A. Horst, Ph.D., MPHS, MS
Anglea S. Gambler
Andrew S. Coco, M.D., MPH
Lancaster General Research Institute
|
 |
 |
 |
ABSTRACT
Background: The recent deployment of Electronic Health Records (EHR) and the H1N1 outbreak in the Lancaster region provided an opportunity to study the infection’s spatial and temporal patterns within a community and its impact on primary care providers.
Objective: Assess the spatial and temporal progression of H1N1 from mid to late 2009.
Design: Retrospective cohort study.
Setting: Primary care offices and the emergency department within the Lancaster General health system in Lancaster County, PA.
Participants: All visits to primary care (family practice, pediatrics and internal medicine) offices and emergency department.
Measurements: Visits for flu (ICD-9 codes) and respiratory syndromes (CDC definition based upon ICD-9 codes) from April 26, 2009 – December 31, 2009. Visits were aggregated by practice, municipality of residence, week of visit, age, gender and payer type.
Results: From the 18th week in 2009 (April 26) through December 31, 2009, there were 3,533 visits for flu with 1,572 (44.5%) ED visits and 1,961 (55.5%) primary care health center/clinic visits. Using GIS (Geographic Information Systems) we mapped the first visits from each municipality and found that the initial cases were in Lancaster City and in the area northwest of the city and then in the later part of the study’s time frame spread to the south and eastern parts of the study area. We found that areas with higher population densities were more likely to have earlier visits for flu adjusted for market share.
Conclusions: Integrated EHR systems provide opportunities to assess the impact of pandemics or common illnesses or syndromes on a community and its health resources. There are also a number of opportunities for future research to improve the modeling of these factors.
BACKGROUND
The increased use of Electronic Health Records (EHR) in the primary care and emergency department (ED) settings brings the potential for timely tracking of visits for surveillance of disease outbreak and spatial patterning in a community. Examples of similar studies have been conducted using ED visits,1-3 primary care visits,4,5 primary care and ED visits,6 over the counter pharmaceutical sales,7 and calls to health related hotlines.8 The recent H1N1 outbreak provides a unique opportunity to study the progression of a disease outbreak in the Lancaster community. H1N1 started to appear in April, 2009 and appeared in two phases with a peak in May/June and a second, much larger peak in late October. 9-11 According to the Centers for Disease Control and Prevention (CDC), influenza activity was above normal during the summer of 2009, and from April onward, with the end of the traditional seasonal flu period, the predominant circulating influenza virus was H1N1.
Based upon our previous work assessing respiratory and gastrointestinal syndromes in the Lancaster community,12 we aimed to assess the spatial and temporal progression of H1N1 in the Lancaster community during mid to late 2009.
METHODS
The study was designed as a cross-sectional review of all patients visiting any of the Lancaster General primary care physician offices or primary care oriented emergency room visits for any reason (26 primary care sites, 1 ED site) during the period of 4/19/2009-12/31/2009. April 19, 2009 (week 17 in calendar year 2009) was selected as the start date due to CDC published data on the start of the H1N1 epidemic, the historical end of seasonal flu, influenza case data for the Mid-Atlantic region, and our observed influenza visit activity.13-15 ICD9 codes for influenza visits were used to identify flu-related visits (487.0, 487.1, and 487.8 in 1st, 2nd or 3rd diagnosis). Subjects were geocoded based upon their home address, or in the case of an invalid address, the zip code centroid was used. We defined the study area as all municipalities in Lancaster County and included some in bordering areas of York, Dauphin and Chester counties based upon methodologies we described in a previous paper.16 Subjects outside this defined study area were excluded.
Our analysis began with determination of the week of first visits for flu by municipality, from which we could assess the spatial progression of H1N1 across the Lancaster community. The methodology is similar to that outlined by Waller and Gotway.17 From the week of first visit, we calculated the weeks from origin, using as a basis week 17 of calendar year 2009 (April 19) for the reasons noted above. Thus, week 18 in calendar year 2009 (April 26) was the first week where data were included in the analysis. “Kriging” (creating a continuous surface through modeling of weeks of origin of first flu cases by municipality; see further discussion below) and vector calculus were used to determine direction and magnitude of first H1N1 cases via slope and aspect calculations of the Kriging surface. To estimate the effect of population density adjusted for estimated market share, we developed a geographically weighted regression model which takes into account the spatial proximity of other municipalities. We performed the analyses for this study using the following software: ArcView (version 9.3.1, ESRI, Redlands, CA); Minitab (version 15, Minitab, Inc., State College, PA) and Stata (version 11.1, College Station, TX). The study was approved by the Lancaster General Hospital IRB.
RESULTS
The overall sample included 607,175 visits; of which 76,650 were ED visits and 530,525 were primary care visits. Of these, 3,533 visits were for flu with 1,572 (44.5%) ED visits and 1,961 (55.5%) primary care health center/clinic visits. There were influenza visits from 73 of 79 municipalities in the defined study area, and those municipalities with no flu visits were excluded from further analysis.
Table 1 shows the descriptive data for the number of weekly flu visits during the study time frame from April 26, 2009 (week 18) through December 31, 2009 (week 53). It also includes the weekly number of municipalities with a first flu visit. During the study time frame, each week had at least one visit for flu with a median of 8 visits and a maximum of 1,042 visits. By week 47 (November 15), all 73 municipalities included in the analysis had their first visit for flu (see Figure 1).
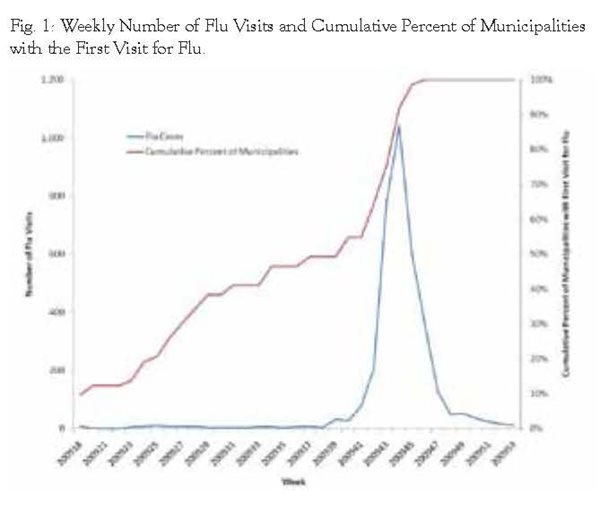
Table 1: Weekly Number of Flu Visits and Number of Municipalities with First Flu Visit.
| |
Mean |
SD |
Min |
Median |
Max |
| Weekly Number of Flu |
100.9 |
236.2 |
1 |
8 |
1042 |
| Weekly Number of Municipalities with First Flu Visit |
2.1 |
2.9 |
0 |
1 |
12 |
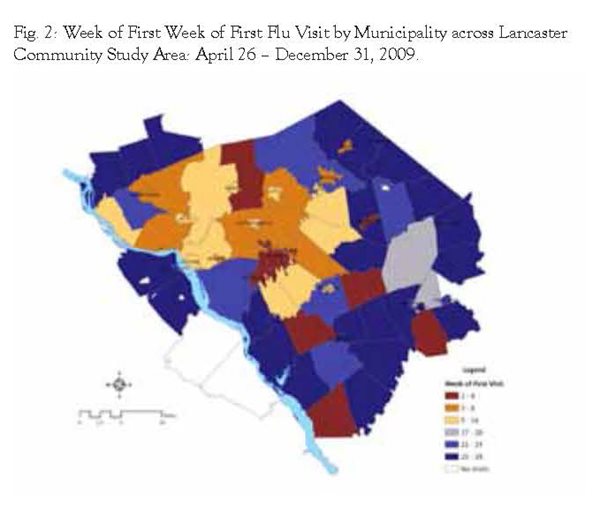
We then mapped the first flu visits by municipality to help determine if the progression of flu visits for H1N1 exhibited a pattern across the Lancaster community study area. Figure 2 shows the study area and weeks of first visit in four week intervals. Earliest visits were observed in the Lancaster City area and 6 other municipalities, but the bulk of earliest visits were observed during the first half of the study time frame in the areas surrounding Lancaster City and the corridor surrounding Route 283 heading northwest. During the later phases of the study time frame, first visits were observed in the majority of the southern and eastern regions of the study area.
As mentioned in the section on Methods, we created a vector map that outlines the directional path of observed first visits and magnitude by utilizing a GIS (Geographic Information Systems) statistical modeling tool called Kriging. This statistical method creates a continuous surface based upon the week of first visit by municipality. From this model, we were then able to estimate direction and magnitude using aspect and slope models which rely upon vector calculus. These were then mapped to show an estimated direction and magnitude of H1N1 in the Lancaster community with a map similar to what is used to display wind speed and direction in weather maps (see Figure 3).
We then assessed the relationship between the population density in each municipality and the week of first flu visit and found that areas with higher population density were more likely to have observed earlier weeks for first flu visits (Pearson correlation = -0.463, p < 0.001, see Figure 4). The relationship between population density and week of first visit by municipality was then adjusted for estimated market share using geographically weighted regression which takes into account the inherent correlations due to spatial proximity of other municipalities. Coefficients are displayed in Table 2 along with the 95% confidence intervals. Interpretation of the population density coefficient is as follows: an increase in population density of 1,000 per square mile decreased the estimated week of first visit by approximately two weeks adjusted for estimated market share.
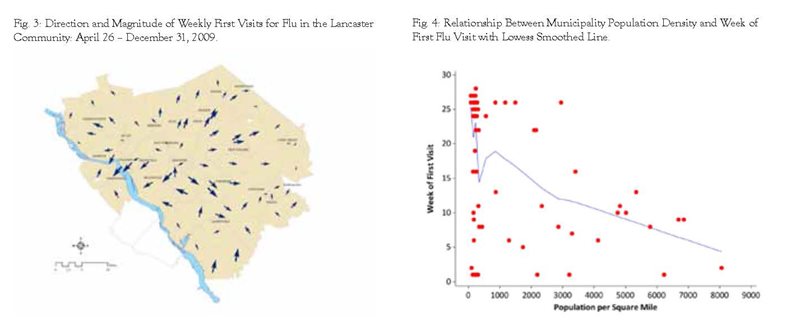
Table 2. Geographically Weighted Regression Coefficients for Population Density
Adjusted for Estimated Market Share to Predict Week of First Visit by Municipality.
| |
Coefficient |
P |
95% CL |
| Population Density (per Square Mile) |
-0.0019 |
<0.001 |
-0.0029 to -0.0009 |
| Market Share |
-14.1400 |
0.009 |
-24.5894 to -3.6906 |
| Constant |
25.2921 |
<0.001 |
20.6204 to 29.9639 |
P < 0.001; r-squared = 0.289; Adj r-squared = 0.269
DISCUSSION
Based upon CDC definitions of the H1N1 pandemic, some areas in the Lancaster community seemed to experience the virus earlier than others. Residents seeking health care for H1N1 in the early stages (late April through the early part of the summer) generally came from Lancaster City and the region around the Route 283 corridor to the northwest of Lancaster City. While there were some municipalities in the southern and eastern part of the Lancaster community that experienced first visits in the early parts of the study time frame, most first visits in these regions were observed later in the study time frame (September through November). Higher population density was associated with higher likelihood of earlier first visits for flu unadjusted and adjusted for estimated market share.
This study uses a visit to a primary care clinic or emergency department as a basis for estimating prevalence of H1N1. Not all individuals sought healthcare during the H1N1 pandemic, and the CDC estimates that between 42-58% of those with H1N1 infection sought medical care in the United States.18 These estimates could be used to create a universal prevalence rate across the entire Lancaster community. An important assumption underlying the data is that there is no or little variability in the propensity to seek health services across the study area. Although it is likely that such variability exists, based on socio-economic status, Amish culture, etc., we presently have no estimates on variability across the Lancaster community which would be a significant variable to add to the model. Future research to describe this variability would be important to help refine estimates using visits as a proxy for prevalence in the local community. It is notable that other studies conducted to develop community based surveillance systems have used primary care or ED visits as a proxy for prevalence without adjustment for the underlying propensity to seek health services.19-24
Presence of the H1N1 virus was identified with an ICD-9 code for influenza based upon a time frame published by the CDC at which point they determined that the seasonal flu had passed and all remaining cases were to be assumed H1N1. During the same time frame, there was a proportional increase in the number of respiratory syndromes in the same practices. Thus we can assume that there is some coding variability during the study time frame with H1N1 cases being identified as common respiratory syndromes and common respiratory syndromes being identified as H1N1. Surveillance systems have been validated with the use of ICD-9 codes as a basis for detection and monitoring of outbreaks despite the coding variability.25-26 For purposes of this study, we are assuming an equal distribution in the coding variability across the study area. Future models to estimate the variability by practice or geographic area may be helpful in adjusting for error in identifying specific syndromes or tracking the geographic progression across the Lancaster community.
To assess the impact of population density, we adjusted for market share based upon zip code estimates across the study region. While not as precise as municipality level estimates, it does provide a crude adjustment to the probability that a first visit may be delayed in an area due to lower market share. As our model suggests, this is a significant variable and would play a role in future models to track the progression of syndromes or pandemics across the community. Future models to predict market share based upon smaller geographic areas such as municipalities would help refine this estimate and adjust for variability in market share to more accurately predict the first cases or prevalence.
Finally, we assumed that the first visit represented the appearance of H1N1 or initial phases of an outbreak in a geographic area. This was based upon statistical analyses presented by Waller and Gotway which outline the progression of rabies across a geographic area.27 The limitations to this assumption are related to those outlined previously, as well as to the possibility that a first case could be a random occurrence, not the herald of a significant grouping of occurrences. Further research could be conducted to determine the association of first visits with an outbreak in a defined geographic area.
We have determined that the general pattern of the H1N1 outbreak in the Lancaster community had a greater probability of starting in the municipalities with higher population density. It started in the Lancaster City area and in the early phases was first observed in the Route 283 corridor northwest of Lancaster City. During the later phases of the outbreak, first cases were observed in the south and eastern sections of the study area. Future research could focus upon identifying the propensity for seeking health services, coding variability, market share, and the nature of associating the first visit with overall geographic area disease activity.
ACKNOWLEDGMENT
This study was funded in part by the H. G. Barsumian Memorial Fund
REFERENCES
1 Heffernan R, Mostashari F, Das D, Karpati A, Kulldorff M, Weiss D. Syndromic surveillance in public health practice, New York City. Emerg. Inf. Dis. 2004; 10(5): 858-864.
2 Balter S, Weiss D, Hanson H, Reddy V, Das D, Heffernan H. Three years of emergency department gastrointestinal syndromic surveillance in New York City: What have we found? MMWR Weekly: August 26, 2005; 54(Suppl);175-180.
3 Infection Watch Live. Todays’ Maps [respiratory and gastrointestinal[. Available at http://www.kflainfectionwatch.com/KFLAMapping/welcome.aspx. Accessed 1 July 2010.
4 Lasarus R, Kleinman K, Dashevsky I, Adams C, Kludt P, DeMaria A, Platt R. Use of automated ambulatory-care encounter records for detection of acute illness clusters, including potential bioterrorism events. Emerg. Inf. Dis. 2002; 8(8): 753-760.
5 Flahault A, Blanchorn T, Dorleans Y, Toubiana L, Vibert JF, Valleron AJ. Virtual surveillance of communicable diseases: a 20-year experience in France. Stat Methods Med Res 2006;15:413–21.
6 Horst M, Coco A. Observing the spread of common illnesses through a community: Using Geographic Information Systems (GIS) for surveillance. J Am Board Fam Med 2010;23:32– 41.
7 Das D, Metzger K, Heffernan R, Balter S, Weiss D, Mostashari F. Monitoring over-the-counter medication sales for early detection of disease outbreaks – New York City. MMWR Weekly: August 26, 2005; 54(Suppl); 41-46.
8 Cooper D, Smith G, Regan M, Large S, Groenewegen P. Tracking the spatial diffusion of influenza and norovirus using telehealth data: A spatiotemporal analysis of syndromic data. BMC Medicine 2008; 6:16.
9 Update: Influenza activity – United States, April – August 2009. MMWR Weekly: September 18, 2009 58(36); 1009-1012.
10 Update: Influenza activity – United States, August 30, 2009 – January 9, 2010. MMWR Weekly: January 22, 2010 59(02); 38-43.
11 Reed C, Angulo F, Swerdlow D, Lipsitch M, Meltzer M, Jernigan D, Finelli L. Estimates of the prevalence of pandemic (H1N1) 2009, United States, April – July 2009. Emerg Infect Dis 15(12): 2004-2007.
12 Horst M, Coco A. Observing the spread of common illnesses through a community: Using Geographic Information Systems (GIS) for surveillance. J Am Board Fam Med 2010;23:32– 41.
13 Update: Influenza activity – United States, April – August 2009. MMWR Weekly: September 18, 2009 58(36); 1009-1012.
14 Update: Influenza activity – United States, August 30, 2009 – January 9, 2010. MMWR Weekly: January 22, 2010 59(02); 38-43.
15 2009 H1N1 Flu: Situation Update. Available: http://www.cdc.gov/h1n1flu/update.htm. Accessed February 23, 2010.
16 Horst M, Coco A. Observing the spread of common illnesses through a community: Using Geographic Information Systems (GIS) for surveillance. J Am Board Fam Med 2010;23:32– 41.
17 Waller L, Gotway C. Applied spatial statistics for public health data. Hoboken, NJ: John Wiley and Sons, Inc.; 2004.
18 Reed C, Angulo F, Swerdlow D, Lipsitch M, Meltzer M, Jernigan D, Finelli L. Estimates of the prevalence of pandemic (H1N1) 2009, United States, April-July 2009. Emerg Infect Dis 2009; 15(12): 2004-2007.
19 Heffernan R, Mostashari F, Das D, Karpati A, Kulldorff M, Weiss D. Syndromic surveillance in public health practice, New York City. Emerg Infect Dis 2004; 10(5): 858-864.
20 Balter S, Weiss D, Hanson H, Reddy V, Das D, Heffernan H. Three years of emergency department gastrointestinal syndromic surveillance in New York City: What have we found? MMWR Weekly: August 26, 2005; 54(Suppl);175-180.
21 Infection Watch Live. Todays’ Maps [respiratory and gastrointestinal[. Available at http://www.kflainfectionwatch.com/KFLAMapping/welcome.aspx. Accessed 1 July 2010.
22 Lasarus R, Kleinman K, Dashevsky I, Adams C, Kludt P, DeMaria A, Platt R. Use of automated ambulatory-care encounter records for detection of acute illness clusters, including potential bioterrorism events. Emerg Infect Dis 2002; 8(8): 753-760.
23 Flahault A, Blanchorn T, Dorleans Y, Toubiana L, Vibert JF, Valleron AJ. Virtual surveillance of communicable diseases: a 20-year experience in France. Stat Methods Med Res 2006;15:413–21.
24 Horst M, Coco A. Observing the spread of common illnesses through a community: Using Geographic Information Systems (GIS) for surveillance. J Am Board Fam Med 2010;23:32– 41.
25 Betancourt J, Hakre S, Polyak C, Pavlin J. Evaluation of ICD-9 codes for syndromic surveillance in the electronic surveillance system for the early notification of community-based epidemics. Mil Med 2007;172:346 –52.
26 Marsden-Haug N, Foster V, Gould P, Elbert E, Wang H, Pavlin J. Code-based syndromic surveillance for influenza-like illness by international classification of diseases, ninth revision. Emerg Infect Dis 2007;13:207–16.
27 Waller L, Gotway C. Applied spatial statistics for public health data. Hoboken, NJ: John Wiley and Sons, Inc.; 2004.