
Fall 2018 - Vol. 13, No. 3
Does a Spoonful of Sugar
Help (More) Medicine Go Down?
Christopher Wenger, DO, FACC, CLS
The Heart Group of Lancaster General Health
“If then there is reason to be concerned about a dietary cause of a widespread disease [obesity], one should look for some constituent of man’s diet that has been introduced recently or has increased considerably, recently.”
— John Yudkin, FRSC, physiologist and nutritionist
INTRODUCTION
Under the dismissive guise of “fat-free calories,” and its ever-expanding value as a food and beverage additive, sugar has crystalized itself as an exemplary carbohydrate while coating doubt as to its potential pernicious effects. We are all familiar with sugar’s effect on tooth decay and its popular pseudonym, “empty calories.” However, what if sugar is not as innocuous as we once thought, and is far more pervasive in our diet than we realize? Mounting research has cast little doubt that added sugar plays a formidable role in cardiovascular disease as well as obesity and its metabolic constituents.
1 Meanwhile, an estimated 75% of all U.S. foods and beverages contain added sugars.
2 Even more sobering is the more recent evidence that sugar is habit-forming
3—and may be up to eight times more addictive than cocaine!
4 Ironically, our involuntary surrender to this edible enslaver may be more bitter than sweet.
BACKGROUND
Sugar can be broadly categorized into two groups – naturally-occurring sugars, and added sugars. The monosaccharides (simple sugars)
fructose, glucose, and
galactose are naturally-occurring sugars that are commonly found in fruit (fructose), some vegetables (glucose), and mammalian milk (galactose). In reasonable amounts, these sugars are mostly innocuous due to the accompanying nutrients contained within the whole food item. For example, a medium-sized apple may contain 130 kilocalories (kcal) and 25 grams (g) of the monosaccharide fructose, but it is primarily composed of water, 5 grams of fiber (which is 20% of the recommended daily value of fiber), 1 gram of protein, and many favorable polyphenols and antioxidants, but no sodium, fat, or dietary cholesterol.
Added sugars are often termed “sweeteners” and include sugars and syrups that are added to foods during preparation or processing, or are simply added at the meal table. They not only provide sweetness, but tend to improve food palatability, assist with food preservation, and provide functional attributes such as viscosity, texture, body, color, and browning capability. Unlike naturally-occurring sugar, it is the increased consumption of added sugar (or sweeteners) which has been linked to a reduced intake of essential micronutrients,
5,6 obesity,
7 and a host of other chronic diseases.
8,9
GLUCOSE VERSUS FRUCTOSE
Given our increased understanding of the bodily effects of added sugars (or sweeteners), fructose, not glucose, appears to have a unique role in metabolic disease states.
8 When not in its natural or monosaccharide form (i.e. fruit or honey), fructose, the sweetest of all sugars, is commonly found in sucrose (common table sugar) or high-fructose corn syrup (HFCS). Sucrose, regardless of its white or brown color, is a disaccharide which consists of 50% fructose and 50% glucose, and is refined from either sugar cane or sugar beets. HFCS also consists of fructose and glucose in various amounts (typically 55% fructose and 45% glucose) and is produced from industrially processed cornstarch. Due to governmental subsidies, HFCS is a cheaper alternative to sucrose and has been the predominant beverage sweetener in the United States since the early 1980s. Sucrose and HFCS are metabolically similar, as the differences between them in their respective concentrations of glucose and fructose are typically negligible.
Despite their chemical similarities, fructose and glucose are metabolized quite differently. Following ingestion, sucrose and HFCS are broken down into fructose and glucose molecules, absorbed in the gut, and travel to the liver via the portal circulation. Unlike glucose, there is almost complete hepatic extraction of fructose. In the liver, another major difference is that fructose bypasses the two highly regulated steps of glycolysis and instead is metabolized to fructose-1-phosphate primarily by fructokinase or ketohexokinase (KHK). Fructokinase has no negative feedback system, and ATP is used in the phosphorylation process. As a result, continued fructose metabolism results in intracellular phosphate depletion, activation of AMP deaminase, and uric acid generation which has been linked to endothelial dysfunction, insulin resistance, and hypertension.
9 The subsequent metabolism of fructose leads to its use as a substrate for hepatic de novo lipogenesis and production of triglyceride-rich lipoproteins which manifest as post-prandial hypertriglyceridemia and increased visceral adipose deposition.
10 The concern over such findings is only supplanted by the growth of sugar ingestion, as fructose has increased both as a percentage of our caloric intake and our total consumption. Americans consume sugar at a rate of 6.5 ounces per day, or 130 pounds per year. Our current fructose intake has increased fivefold compared to a century ago and has more than doubled in the last 30 years.
11
SUGAR-SWEETENED BEVERAGES AND DIABESITY
For most Americans, the consumption of liquid calories is likely the principle daily determinant of their “burning fat” or “storing fat,” as caloric sweeteners add calories without providing satiety or essential nutrients. The Centers for Disease Control and Prevention (CDC) states that over the past 15 years, the prevalence of adult and pediatric obesity has risen by 23% and 25%, respectively.
12 Currently, the prevalence of overweight and obesity (BMI >25 kg/m2) is an astonishing 70.2%!
13
Paralleling this obesity trend is the incidence of diabetes, which has more than quintupled from 4.2 million people in 1970 to over 25 million people now, to the point that 1 in 10 Americans is currently diabetic. This growth shows no sign of slowing and, by 2050, the incidence of diabetes is predicted to increase to 1 in 3 Americans.
14 Multiple studies, including longitudinal studies and randomized controlled trials, have linked added sugars – particularly sugar-sweetened beverages (SSBs) – with increased daily caloric intake, excess weight gain, and increased risk of diabetes and obesity.
15-18 Moreover, a time-trend analysis over the past three to four decades has shown a close parallel between the rise in added sugar intake and the epidemics of obesity and diabetes in the United States.
19 This trend is primarily driven by the over-consumption of SSBs which have become the single greatest source of calories and added sugars in the U.S. diet, comprising nearly 50% of all added sugar consumption.
20
GUIDELINES
Added sugars may be safely consumed in small amounts as part of an otherwise healthy diet, but few Americans meet the guideline recommendations for added sugar. Excessive intake remains the norm rather than the exception despite a small decrease in SSB consumption in recent years. The American Heart Association (AHA) recommends limiting added sugars to 150 kilocalories (kcal) or nine teaspoons daily for men, and no more than 100 kcal or six teaspoons for women.
15 In order to limit calories from added sugars as a means of meeting daily food group and nutrient requirements, the U.S. Department of Agriculture (USDA) recommends an added sugar limit of no more than 10% of daily caloric intake.
20 Similarly, the World Health Organization (WHO) strongly recommends that adults and children reduce their daily intake of added sugar to less than 10% of their daily total energy intake with additional health benefits for those who reduce added sugar consumption further to less than 5% (or roughly 25 grams) daily.
21
PERSPECTIVE
The next time you are at a grocery store, observe the nutrition label on a package of sugar. You may note that sugar is a pure carbohydrate as it contains no fat or protein. Further investigation of this label will reveal that 4 grams of sugar are equivalent to 1 teaspoon of sugar. With this simple information, you can view SSBs with much greater scrutiny and, sadly enough, more accurately quantify grams of sugar than most Americans (Fig. 1).
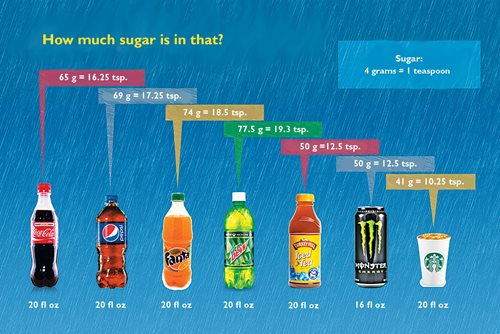
Fig. 1. Amounts of added sugar in various popular sugar-sweetened beverages. Note that the Starbucks beverage is a caramel macchiato, the most popular beverage at the Fruitville Pike Starbucks in Lancaster, Pa.
For example, a seemingly innocuous 20-ounce bottle of Pepsi contains 69 grams of sugar—the equivalent of 17.25 teaspoons of sugar. Since there are 4 kcal for each gram of carbohydrate, this single serving of Pepsi boasts 276 kcal which would account for 13.8% of caloric allowance in a standard 2,000 kcal/day diet. This means that a person consuming one 20-fluid-ounce bottle of Pepsi assimilated 48% more added sugar than the upper limit recommended by even the most liberal guideline, adding almost 130 kcal more of calories from a substance that is nutritionally bankrupt. This would be bad enough if such a person consumed no other added sugar in any food or beverage for the remainder of the day, but it gets worse. The 70% of Americans who consume more than the recommended upper limit of daily added sugar intake are consuming an average of 25.1 teaspoons (or 105 grams) of added sugar daily!
22
PRACTICAL STRATEGIES
First, patients should understand that sucrose is not “healthier” than HFCS and vice versa. When a food product boasts that it contains no HFCS, caution should be exercised as sucrose likely replaced HFCS. Patients should be encouraged to choose water for hydration whenever possible. If a patient is attempting to reduce non-carbonated SSBs (i.e. sports drinks or iced tea) and happens to be averse to the subtle taste of water, they may consider allowing fruit to soak in their water, or try a non-caloric flavored water or tea. Those attempting to reduce or eliminate sugar-sweetened (carbonated) beverages may consider switching to a non-caloric flavored seltzer, sparkling, or mineral water, as the carbonation of these zero-calorie soda replacements provides familiarity during a transition from soda and other fizzy drinks.
Patients should be encouraged to consume whole fruit in place of fruit drinks or fruit juice, particularly if the juice is not made with 100% fruit juice. Fig. 2 helps to demonstrate that there is no such thing as a healthy fruit juice.

Fig. 2. Comparative differences of sugar and fiber concentration among fruit juice and whole fruit.
Although fruit juice contains predominately natural sugar, the protective fiber and various phytonutrients and polyphenols have been stripped away from the whole fruit. Fiber blunts the blood sugar response to the monosaccharides contained in the fruit juice. For example, one can drink a 20-ounce apple juice without difficultly. However, how may apples can that same person consume in one sitting? Fiber not only blunts the blood sugar response (thus less insulin release), but is also nature’s way of placing the brakes on over-eating.
Hot teas and coffees have a place among healthy beverage options, but one must exercise caution when considering creamer or sugar additives. If a patient consumes calorically sweetened beverages, they should keep portion sizes small enough to meet any of the guideline recommendations for added sugar consumption.
MOVING FORWARD
The escalating health care costs attributed to diet-related chronic disease states has prompted public calls for a tax on caloric sweetened beverages. Berkeley, Calif., introduced a tax on SSBs in March 2015 and has seen sales of such beverages fall by 9.6% while sales for water rose by 15.6% during this same period. Seattle, Wash., became the eighth U.S. municipality to pass a tax on sugar-sweetened beverages in 2017, joining Berkeley, Philadelphia, San Francisco, Oakland, Albany, Boulder, and Cook County. Governmental taxation of SSBs is gaining traction, and monies raised could be dedicated to health programs to prevent obesity in children and adults.
23 Although taxation is not a cure-all, it does help to mitigate excessive added sugar consumption, raise public awareness, and provide funds to support health programs. Moreover, public health and clinical medicine have made strides in reducing SSB consumption. Such advances have been backed by national guideline initiatives aimed at public education, while health-related professional organizations have provided medical education and endorsement to reduce the consumption of SSBs.
The hospital is a role model for patients, visitors, and staff, and their nutritional offerings should set high quality standards. And though each individual is responsible for the choices that impact their health, many food choices bypass conscious deliberation and are strongly influenced by the environment in which they are made. Thus, it may be a hospital system’s ethical responsibility to make healthy choices the easy ones. Hospitals have no obligation to provide definitively unhealthful foods, and there is an ethical problem with doing so. Hospital cafeterias should capitalize on their inherent convenience, and promote healthful options over the unhealthful ones available elsewhere – both for the good of the institution’s bottom line and the health of patients, visitors, volunteers, and staff.
In an exemplary fashion, Penn Medicine Lancaster General Health has recently announced a plan to reduce, and ultimately eliminate, the sale of SSBs. This includes the removal of any beverages that contain added sugars, such as soda, sports drinks, fruit-flavored drinks, and sweetened milks. Diet sodas and 100% fruit juices will continue to be offered, while many new zero-calorie beverage options will become available. Employees, patients, and visitors may bring their own SSBs from home. This initiative bolsters Lancaster General Health’s status as an organization that uses its influence and resources to promote health and prevent illness in an era when chronic diseases are prevalent.
CONCLUSION
The amount of added sugar and related caloric sweeteners currently consumed by Americans pose substantial health risks that must be acknowledged and acted upon immediately. The best place to begin is the reduction or elimination of sugar-sweetened beverages, as they constitute nearly half of all added sugars in the U.S. diet, and offer no nutritional value. This step is not a panacea for obesity or metabolic syndrome, but it is a formidable start. Doctors (derived from the Latin
docere, “to teach”) and other medical providers should take a proactive role in teaching patients how to quantify their added sugar intake, follow guideline recommendations, and choose healthier beverage substitutes.
Further, hospital systems should promote dietary changes in their communities; to do otherwise would undermine the efforts of countless health care providers, and would arguably tarnish the hospitals’ ethical integrity. I applaud Penn Medicine Lancaster General Health for its continued innovative leadership and promotion of population wellness, as it seeks to foster all aspects of health. Their timely initiative to remove SSBs from the health system symbolizes the hospital’s caring relationship with its staff and the broader community.
REFERENCES
1. Malik VS, et al. Fructose and cardiometabolic health: What the evidence from sugar-sweetened beverages tells us. J Am Coll Cardiol. 2015; 66(14):1615-1624.
2. Ng SW, Slining MM, Popkin BM. Use of caloric and noncaloric sweeteners in US consumer packaged foods, 2005-2009. J Acad Nutr Diet 2012; 112:1828-1834.e1-6.
3. Shariff M, Quik M, Colgate J, et al. Neuronal nicotinic acetylcholine receptor modulators reduce sugar intake. PLoS One. 2016; 11(3): e0150270.
4. Lenoir M, Serre F, Cantin L, et al. Intense sweetness surpasses cocaine reward. PLoS One. 2007; 2(8): e698.
5. Marriott BP, Olsho L, Hadden L, et al. Intake of added sugars and selected nutrients in the United States, National Health and Nutrition Examination Survey (NHANES) 2003–2006. Crit Rev Food Sci Nutr 2010; 50(3):228–258.
6. Bowman SA. Diets of individuals based on energy intakes from added sugars. Family Economics and Nutrition Review. 1999; 12(2):31–38.
7. Vartanian LR, Schwartz MB, Brownell KD. Effects of soft drink consumption on nutrition and health: A systematic review and meta-analysis. Am J Public Health 2007; 97:667–675.
8. Schwarz JM, Clearfield M, Mulligan K. Conversion of sugar to fat: is hepatic de novo lipogenesis leading to metabolic syndrome and associated chronic diseases? J Am Osteopath Assoc. 2017;117(8):520-527.
9. Johnson RJ, Segal MS, Sautin Y, et al. Potential role of sugar (fructose) in the epidemic of hypertension, obesity and the metabolic syndrome, diabetes, kidney disease, and cardiovascular disease. Am J Clin Nutr 2007;86: 899-906.
10. Stanhope KL, Medici V, Bremer AA, et al. A dose-response study of consuming high-fructose corn syrup-sweetened beverages on lipid/lipoprotein risk factors for cardiovascular disease in young adults. Am J Clin Nutr 2015;101: 1144-1154.
11. M.B. Voss, et al. Dietary fructose consumption among us children and adults: the third national health and nutrition examination survey. Medscape J. Med 2008;10(7): 160.
12. Hales CM, Carroll MD, Fryar CD, et al. Prevalence of obesity among adults and youth: United States, 2015–2016. NCHS data brief, no 288. Hyattsville, MD: National Center for Health Statistics. 2017.
13. Fryar CD, et al. Prevalence of overweight, obesity, and extreme obesity among adults aged 20 and over: United States, 1960-1962 through 2011-2014. National Center for Health Statistics Data, Health E-Stats, July 2016.
14. Boyle JP, et al. Projection of the year 2050 burden of diabetes in the US adult population: dynamic modeling of incidence, mortality, and prediabetes prevalence. Population Health Metrics 2010; 8:29. doi:10.1186/1478-7954-8-29.
15. Johnson RK, et al. Dietary sugars intake and cardiovascular health: a scientific statement from the American Heart Association. Circulation 2009;120: 1011-1020.
16. Bachman CM, Baranowski T, Nicklas TA. Is there an association between sweetened beverages and adiposity? Nutr Rev 2006;64: 153-174.
17. Malik VS, Schulze MB, Hu FB. Intake of sugar-sweetened beverages and weight gain: a systematic review. Am J Clin Nutr 2006;84: 274-288.
18. Johnson L, Mander AP, Jones LR, et al. Is sugar-sweetened beverage consumption associated with increased fatness in children? Nutrition 2007;23: 557-563.
19. Bray GA, Nielsen SJ, Popkin BM. Consumption of high-fructose corn syrup in beverages may play a role in the epidemic of obesity. Am J Clin Nutr 2004;79: 537-543.
20. U.S. Department of Health and Human Services and U.S. Department of Agriculture. 2015 – 2020 Dietary Guidelines for Americans. 8th Edition. December 2015.
21. World Health Organization. Guidelines: sugars intake for adults and children: WHO guidelines approved by the Guidelines Review Committee. 2015.
22. Bowman SA, Clemens JC, Martin CL, et al. Added sugars intake of Americans: what we eat in America, NHANES 2013-2014. Food Surveys Research Group. Dietary Data Brief No. 18. May 2017.
23. Brownell KD, et al. The public health and economic benefits of taxing sugar-sweetened beverages. N Engl J Med. 2009;361(16):1599-1605.