Summer 2017 - Vol. 12, No. 2
Black Cloud or White Cloud?
A Study of How Residents Perceive Their Workloads
Adam C. Lake, M.D., AAHIVS, CMQ
Associate Director
*LGH Family & Community Medicine Residency
Nicholas A. Buckwalter, M.D.
Family Practice Physician
*WellSpan Family Medicine-Manheim
Michael A. Horst, PhD, MPHS, M.S.
Director of Research Biostatistics and Quality
Lancaster General Research Institute
Editor’s Note: As background to the following study, which assesses the influence of superstition on residents’ perceptions, I thought it would be interesting to point out some experiments that have assessed whether one’s perception of luck can influence performance.
Researchers at the University of Cologne assessed the influence of superstition on several motor and cognitive tasks. **In particular, they found that telling participants they had a lucky golf ball significantly improved their performance in a standard putting protocol. However, a study at Dominican University in Illinois that replicated the original study precisely (other than using American subjects instead of Germans), found no such effect. ***
The later researchers felt certain that their failure to replicate the original study was not due to lack of impact or statistical power, nor to differences in task difficulty or the participants’ beliefs in luck. A meta-analysis indicated significant heterogeneity in the effect of superstition on performance, and they concluded that the variability could be due to an unknown moderator. Importantly, no effect was observed among the studies with the strongest research designs.
ABSTRACT
Background and Objectives: There is a superstitious belief among medical providers that they are either a “black cloud or a white cloud.” Black clouds have busier calls and clinics, with more frequent and complicated admissions. Little is known about correlating factors.
Methods: This was an observational cohort study looking at 16 months of clinical data. The cohort was four classes of a three-year family medicine residency based in a community health system in a county of 500,000 people. We assessed workload, personality (Neuroticism-Extraversion-Openness Five Factor Inventory version 3 (NEO-FFI3)), burnout (Maslach Burnout Inventory (MBI)), time to outpatient chart closure, and locus of control (Rotter I-E test). We predicted no association between these factors and cloudiness as described by our novel instrument, the Buckwalter-Lake Assessment of Cloudiness (BLAC).
Forty-one of 49 eligible residents completed the initial assessment, and 28 completed the six-month follow-up assessment. Thirteen residents graduated between the two assessments.
Results: On the initial assessment there was no association between any factors. On the six-month follow up assessment, there was a significant negative association between MBI-depersonalization and BLAC score (p=0.03). The BLAC tool was found to have limited, but acceptable reliability for measurement of cloudiness.
Conclusions: Being a black cloud does not correlate with workload, chart closure efficiency, locus of control, or personality, but it may have an inverse association with burnout. Multiple tests of association increased the risk of a Type I error, so these results should be interpreted with caution.
INTRODUCTION
Superstitions are quite prevalent in modern society, with a recent poll showing that more than half of Americans engage in some type of superstitious behavior.
1 The prevalence of superstition among American medical providers is less well known, although one study suggested it is relatively high among perioperative nurses in Pittsburgh, PA.
2 Furthermore, studies in Japan
3 and Singapore
4 found that physicians there are also quite superstitious.
A common superstitious belief among medical providers is being either a “black or white cloud.” While no formalized definition exists, black clouds are thought to have busier calls, including more frequent and complicated admissions, and responsibility to care for sicker patients. White clouds are generally identified as having easier calls. Being a black or white cloud, hereafter referred to as “cloud status,” may be self-perceived or perceived by others. There have been two studies done looking at those identified as black clouds and comparing workload to their peers. One study showed no increase in workload,
5 while another showed a higher rate of admissions for those labeled as black clouds.
6 While the first study did not show any correlation between cloud status and workload, the residents who were black clouds reported sleeping less, perceived that they worked harder than average, and had a reputation for having difficult on-call experiences. For the purposes of this study, we evaluated cloud status as a self-identification. We also hypothesized that black clouds may be less efficient or may create extra work for themselves.
There have been no studies done investigating a correlation between cloud status and burnout. Compared to the general population, physician burnout is common in every stage of training and across specialties.
7-10 We hypothesized that there would be a positive correlation between burnout and self-identification as a black cloud. In addition to workload, tendency to procrastinate, and burnout, we hypothesized that two additional factors may have explanatory power. First, personality, as measured in the NEO-FFI3, may have an impact on cloud status.
Cloud status may be related to catastrophization, which has been shown to correlate with personality traits in studies looking at pain.
11 Second, we conceptualized cloud status as something out of the control of the resident, and thus hypothesized that if the resident had an external locus of control, as measured by the Rotter I-E scale, they would be more likely to be a black cloud. (Locus of control refers to the degree to which people feel that they have control over their lives – internal locus of control relating to a sense of control and an external locus of control relating to fatalism and a lack of control.) A previous study in nurses has correlated locus of control with tendency toward burnout and perceived work stress.
12
METHODS
Setting
The population studied was the Lancaster General Health Family and Community Residency Program. It is a three-year family medicine residency consisting of 13 residents per year based in Lancaster, PA, USA. Each night at Lancaster General Hospital, two or three residents on-call are responsible for all inpatient emergencies for two internal medicine services totaling about 150 patients, plus direct care for approximately 15-30 adult patients, and all pediatric admissions to the pediatric hospitalist service. Because there is no pediatric intensive care unit at this hospital, critically ill children are transferred to nearby children’s hospitals. Obstetrical care is provided at a separate facility and the residents are involved in approximately 800 deliveries per year. There are always either one or two residents on-call at the obstetrical hospital. The residents follow patients on the obstetrical service regardless of risk, and are also responsible for all obstetrical triage visits for several family medicine and obstetrical practices during that time.
This study was reviewed and approved by the Institutional Review Board of Lancaster General Health (Protocol number: 2013-42-LGH).
Study Design
This research was observational and no interventions were intended or executed beyond the assessment itself. In June 2013 the authors presented the proposed research study to all eligible 49 family medicine residents at Lancaster General Hospital Family and Community Medicine Residency in four different class years: new interns beginning residency, and residents at the completion of their 1st, 2nd, and final years of family medicine training. The authors were residents in the program at the time, and were excluded from participation. There were no other exclusion criteria. One class only had 12 residents. Residents who consented to the research protocol completed the initial set of questionnaires on paper, consisting of the Neuroticism-Extraversion-Openness Five Factor Inventory version 3 (NEO-FFI-3); Rotter I-E scale (RIE); the Maslach Burnout Inventory (MBI); and a novel instrument,
the Buckwalter – Lake Assessment of Cloudiness (BLAC), which is a questionnaire exploring perceived relative workloads and self-identification as a “black cloud” or “white cloud.”
The BLAC consisted of 10 five-point Likert scaled questions with possible total scores ranging from 10-50, with a score of 50 indicating the “blackest” of clouds. The full text of this survey is available online in
Supplement 1. We constructed the BLAC to account for the various responsibilities faced while on-call, as well as how the respondent felt he or she was perceived by other residents. Our intent was to create a self-contained tool, accounting for previously noted factors,
5,6 while not relying on group consensus.
6 NEO-FFI-3 scores were scored according to gender, consistent with standard procedure with this assessment. Residents were contacted in person, via email, and through internal mailings to complete the MBI and BLAC assessments six months later. This was performed to assess whether cloudiness, as measured by the BLAC, is a static or a dynamic construct, and if there was a correlation with burnout at the time.
These data were then compared to data gleaned from our health system’s electronic medical record (EMR) from 1 September 2012 until 31 December 2013. We extracted the number of adult admissions to the hospital, which were stratified by admission to an Intensive Care Unit (ICU) bed or a non-ICU bed for adults, and admission or transfer for pediatric cases. Additionally, for each resident, we identified the number of overnight internal transfers to the ICU, and obstetrical triage visits, as well as the average time to completion of each resident’s outpatient clinic charts. Average chart closure time was included as a measure of efficiency. A separate database relating to identification of high-risk or low-risk obstetrical deliveries was queried to identify the level of risk that was qualitatively documented by the residents and presence or absence of postpartum complications for each delivery attended by the residents while on call.
We initially intended to evaluate the number of times that residents were paged each night, as well as the number of critical resuscitation episodes they attended, but we could not obtain data that could be reliably correlated with the residents on call schedule.
STATISTICAL METHODSi
Each measure of inpatient workload analyzed using a z-score for workload. (A z-score, also known as a standard score, indicates how any single data point compares with the mean for the group. It is calculated in standard deviations, and can be positive or negative. A data point with a z-score of +1 is one standard deviation above the mean.) By summing workload z-scores, we created a composite total workload score for purposes of comparison. Outpatient clinic chart time-to-closure was captured via the EMR as a separate measure and the median was calculated for each resident and then was transformed using a logarithmic transformation due to the extreme outliers for some of the residents.
Coefficient alpha, which is a function of reliability and consistency of data based on the number of items and their inter-correlation, was calculated for the combined baseline and six-month administration of the BLAC scale.
Graduating residents who were included in the first assessment were not assessed in the subsequent assessment.
 Results
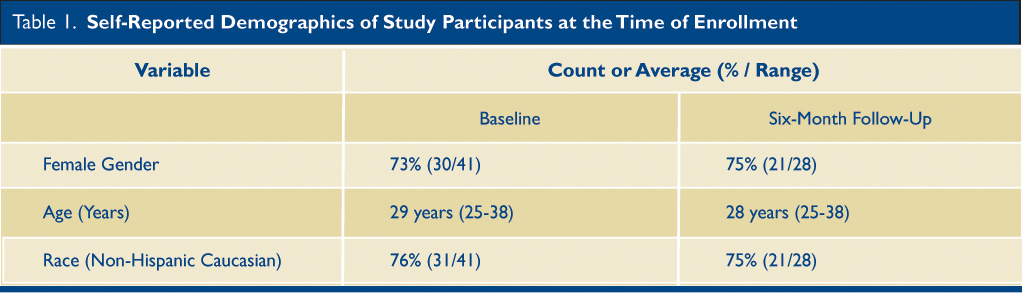
Forty-one residents consented to and completed the initial assessment, and 28 completed the follow up assessment (Table 1). Based on self-reported demographic characteristics, 74% of participants were female, with an average age of 29 years (range 25-38 years) at the time of enrollment. Seventy-four percent of the cohort self-identified as non-Hispanic white ethnicity. Groups completing the initial and subsequent assessments were similar.
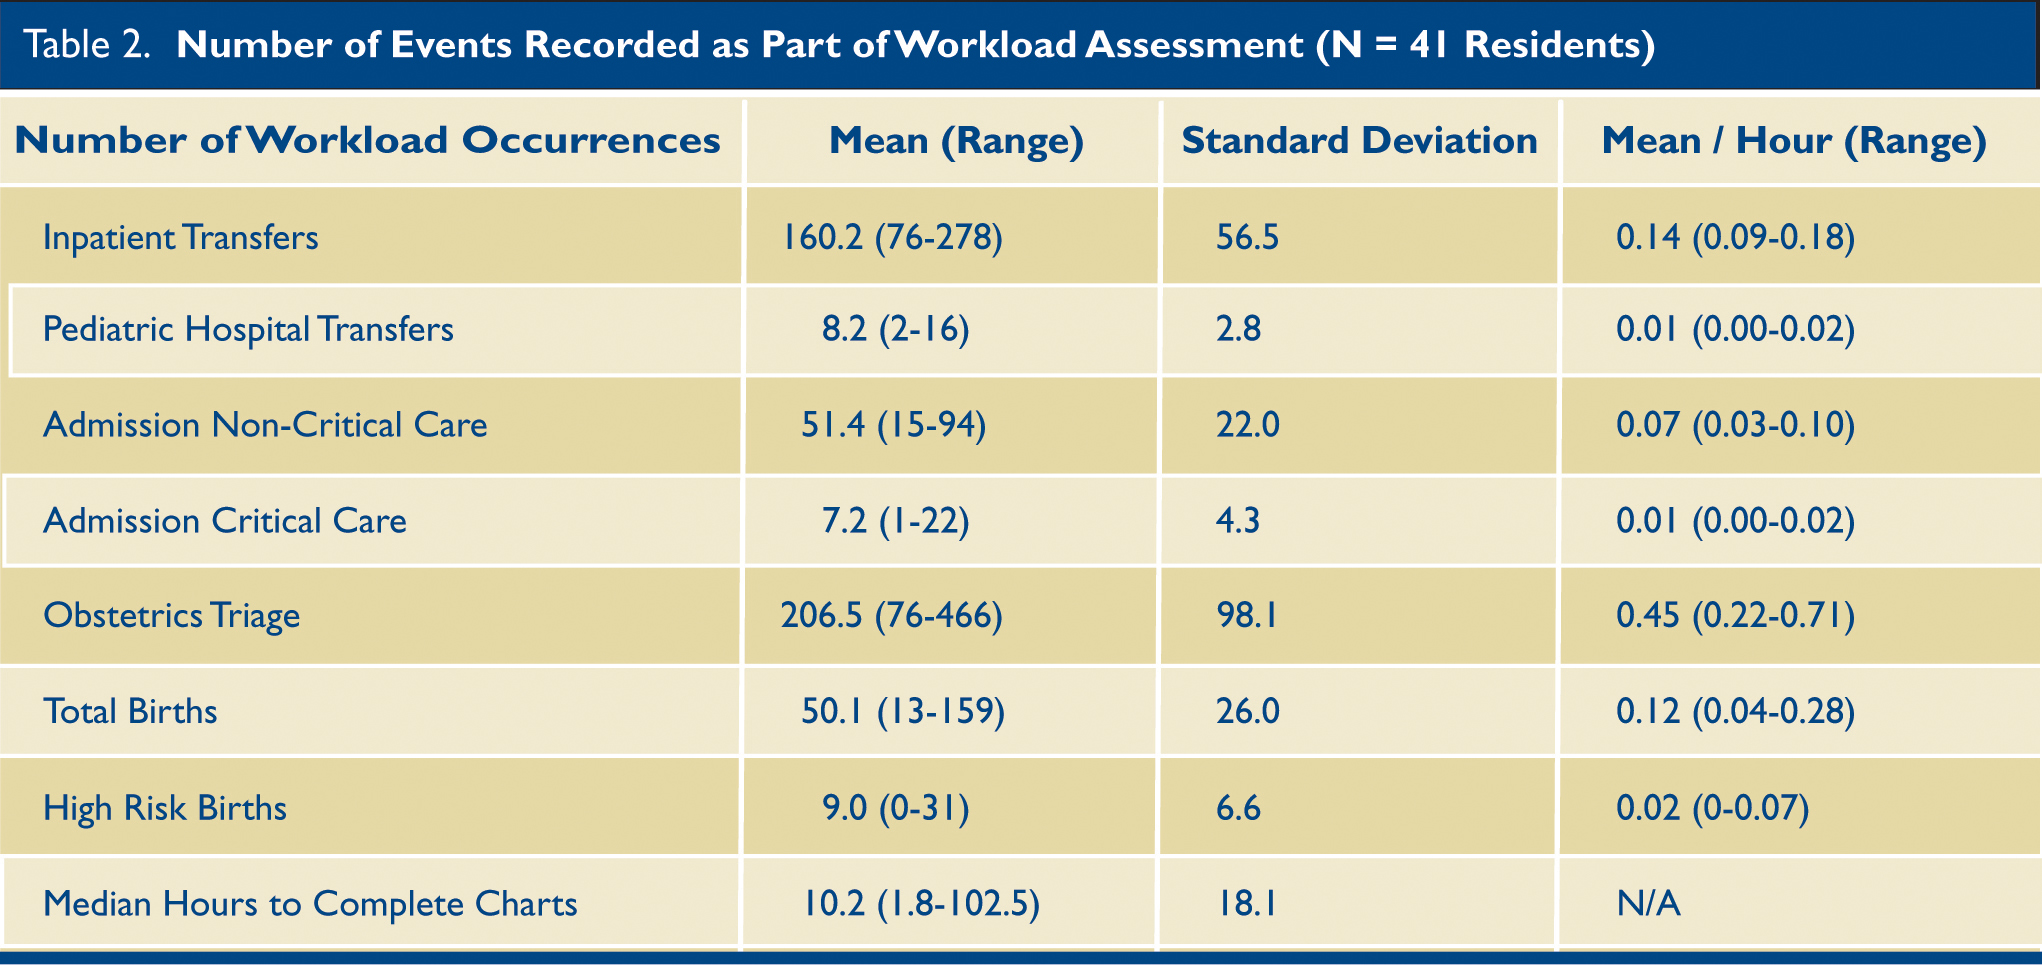
We identified 19,829 total workload occurrences while residents were on call (Table 2). When z-scores of on-call workloads were compared with initial or subsequent BLAC scores, there was no significant association with specific types of workload occurrences, or overall summary workload (for each, p>0.05) (Table 3 and Table 4). We reviewed the time stamps in the EMR for the start of outpatient office visits until the closure of the chart for 42,909 separate visits (range per resident: 95-1885). The logarithmic transformation of the median time to outpatient chart closure was not found to correlate significantly with the initial or subsequent BLAC assessments.
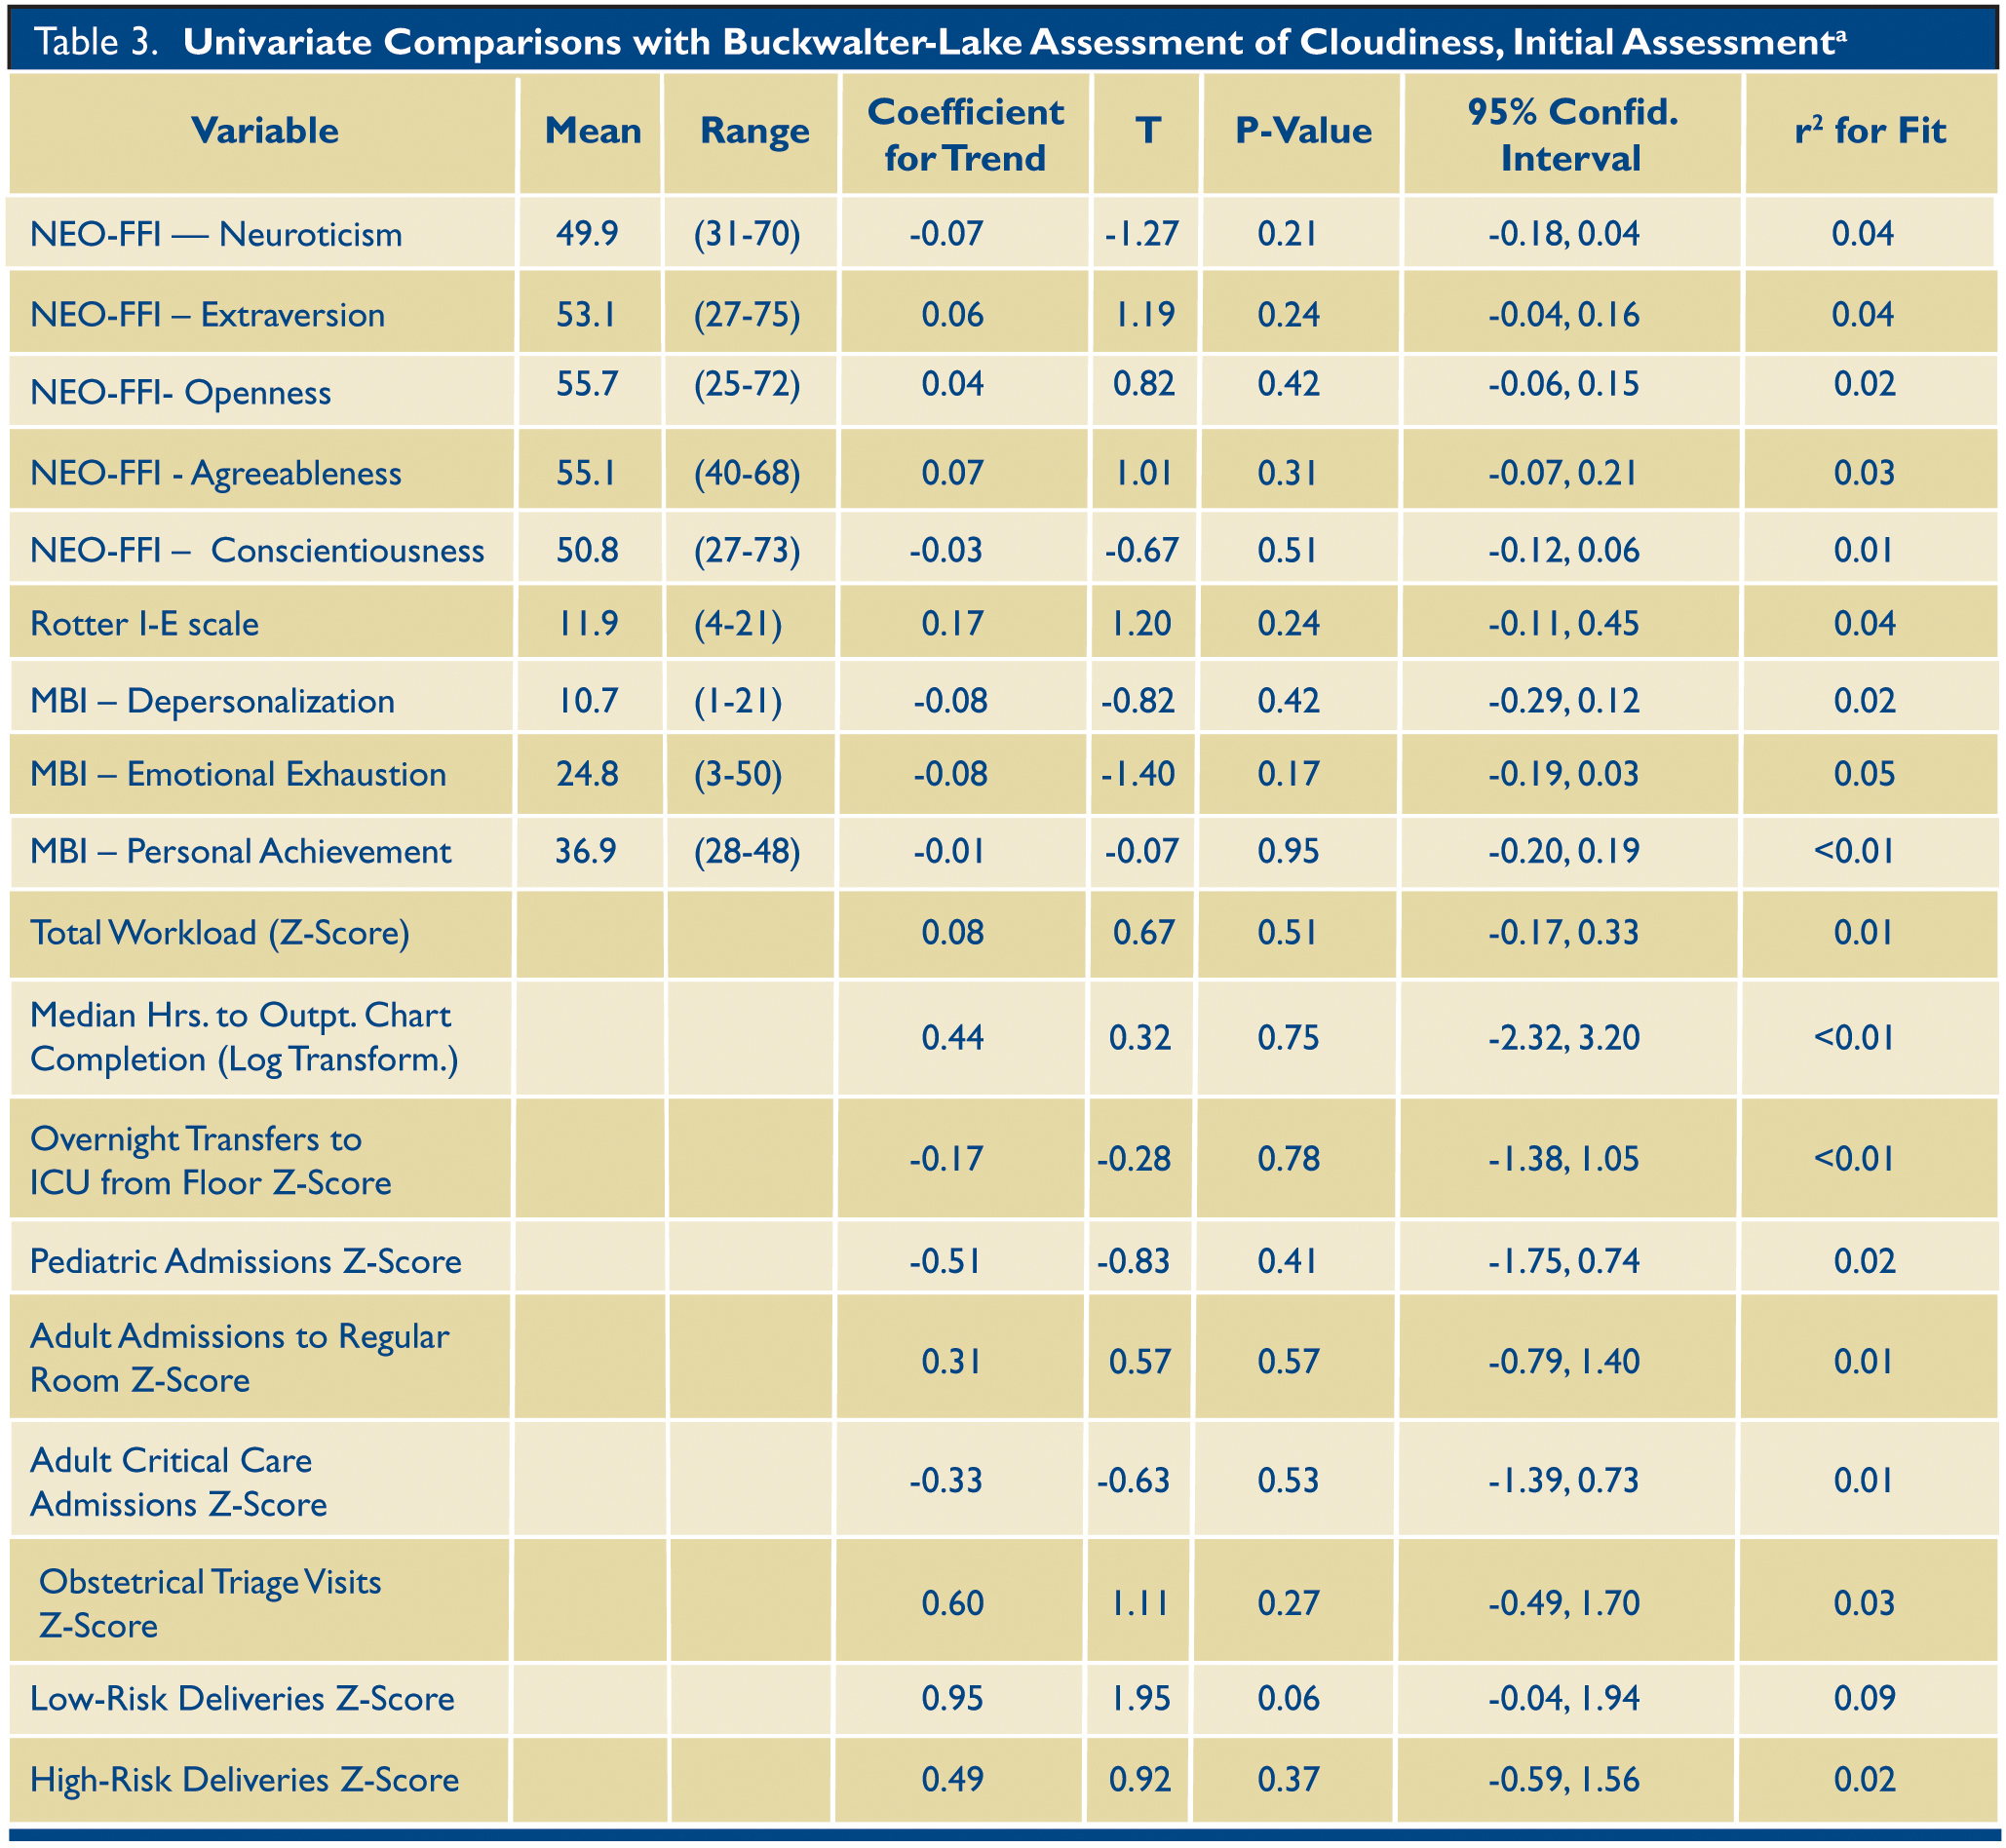 a All measures of workload were converted to a z-score prior to performing linear regression analysis with the exception of median hours to outpatient chart closure which was logarithmically transformed. NEO-FFI: Neuroticism-Extraversion-Openness-Five Factor Inventory, version 3. MBI: Maslach Burnout Inventory. Mean and range not reported for z-score adjusted variables. Mean and range not reported for transformed data, see Table 2 for data prior to transformation.
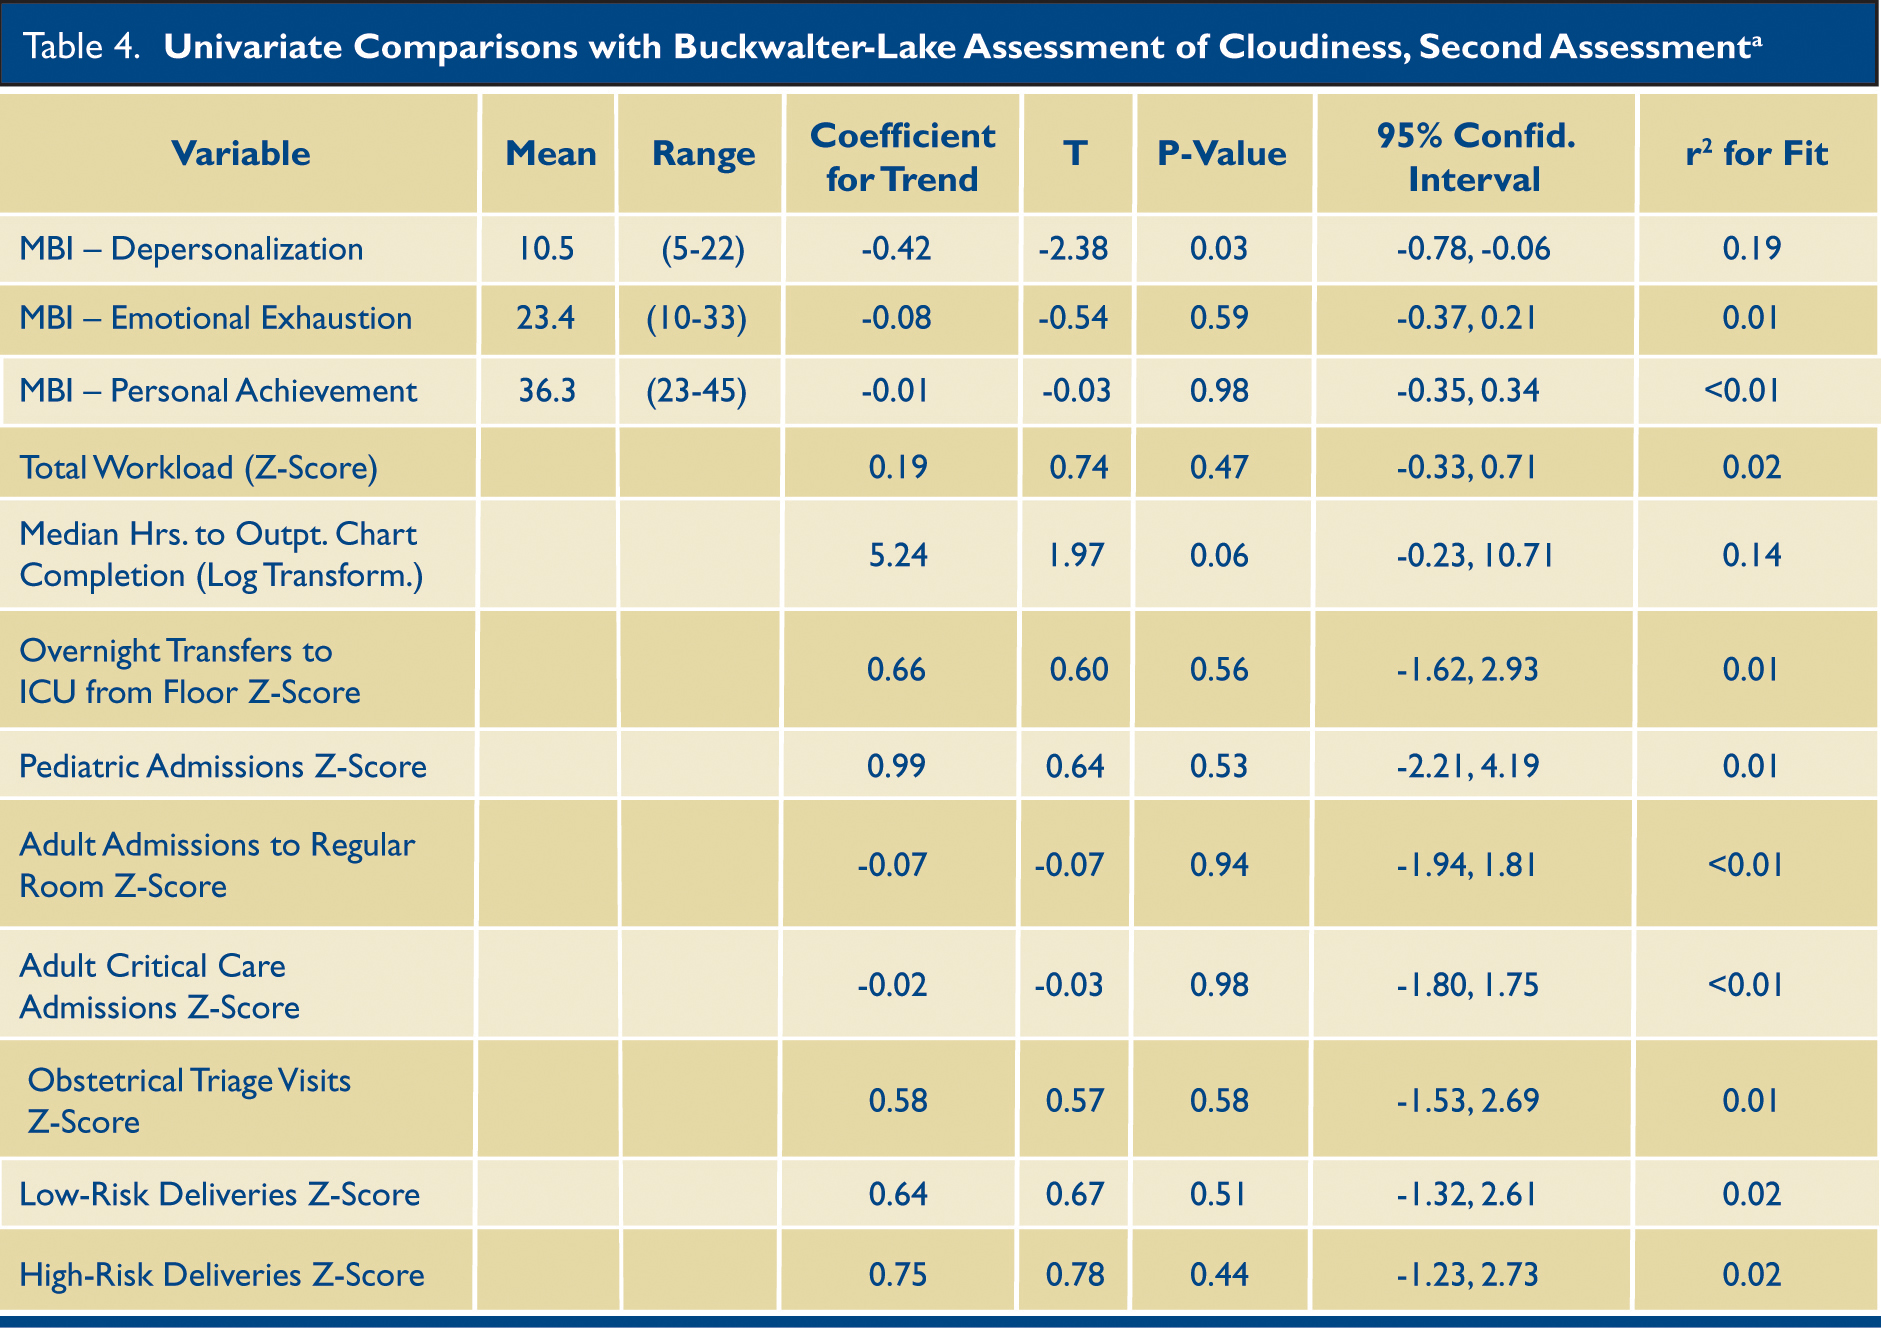 a All measures of workload were converted to a z-score prior to performing linear regression analysis except for median hours to outpatient chart closure which was logarithmically transformed. MBI: Maslach Burnout Inventory. Mean and range not reported for transformed data, see Table 2 for data prior to transformation.
BLAC scores ranged from 21-35 on baseline assessment and 16-33 on follow up testing six months later. We calculated coefficient alpha for the combined baseline and six-month administration of the BLAC scale to be 0.75. The overall alpha for the BLAC was 0.66 for the first assessment, and 0.82 for the six-month assessment. There was an association between the two assessments on linear regression analysis (coefficient=0.933, p<0.001, r2=0.47), but there was a significant decrease in scores from the baseline to the six-month assessment (mean difference = -1.4, Standard deviation = 3.39, p=0.04). Personality traits in all five domains measured by the NEO-FFI3 (Neuroticism, Extraversion, Openness to Experience, Agreeableness, or Conscientiousness) were not significantly correlated with initial BLAC scores in any domain (for each p>0.05) (Table 3). Rotter I-E scores ranged from 4-21 with a mean of 11.9, there was no association observed with initial BLAC score (p=0.24).
The MBI (Maslach Burnout Inventory ) was administered at the same time as the BLAC at both time points. The initial MBI did not correlate with the initial BLAC score (Table 3). The second assessment indicated a significant (P=0.03) inverse correlation between depersonalization and BLAC score (slope of linear trend = -0.41) (Table 4, Fig. 1). This association was not present on the first assessment, even after excluding residents who were just beginning their first year, or looking only at those with data from both time points (p=0.26).
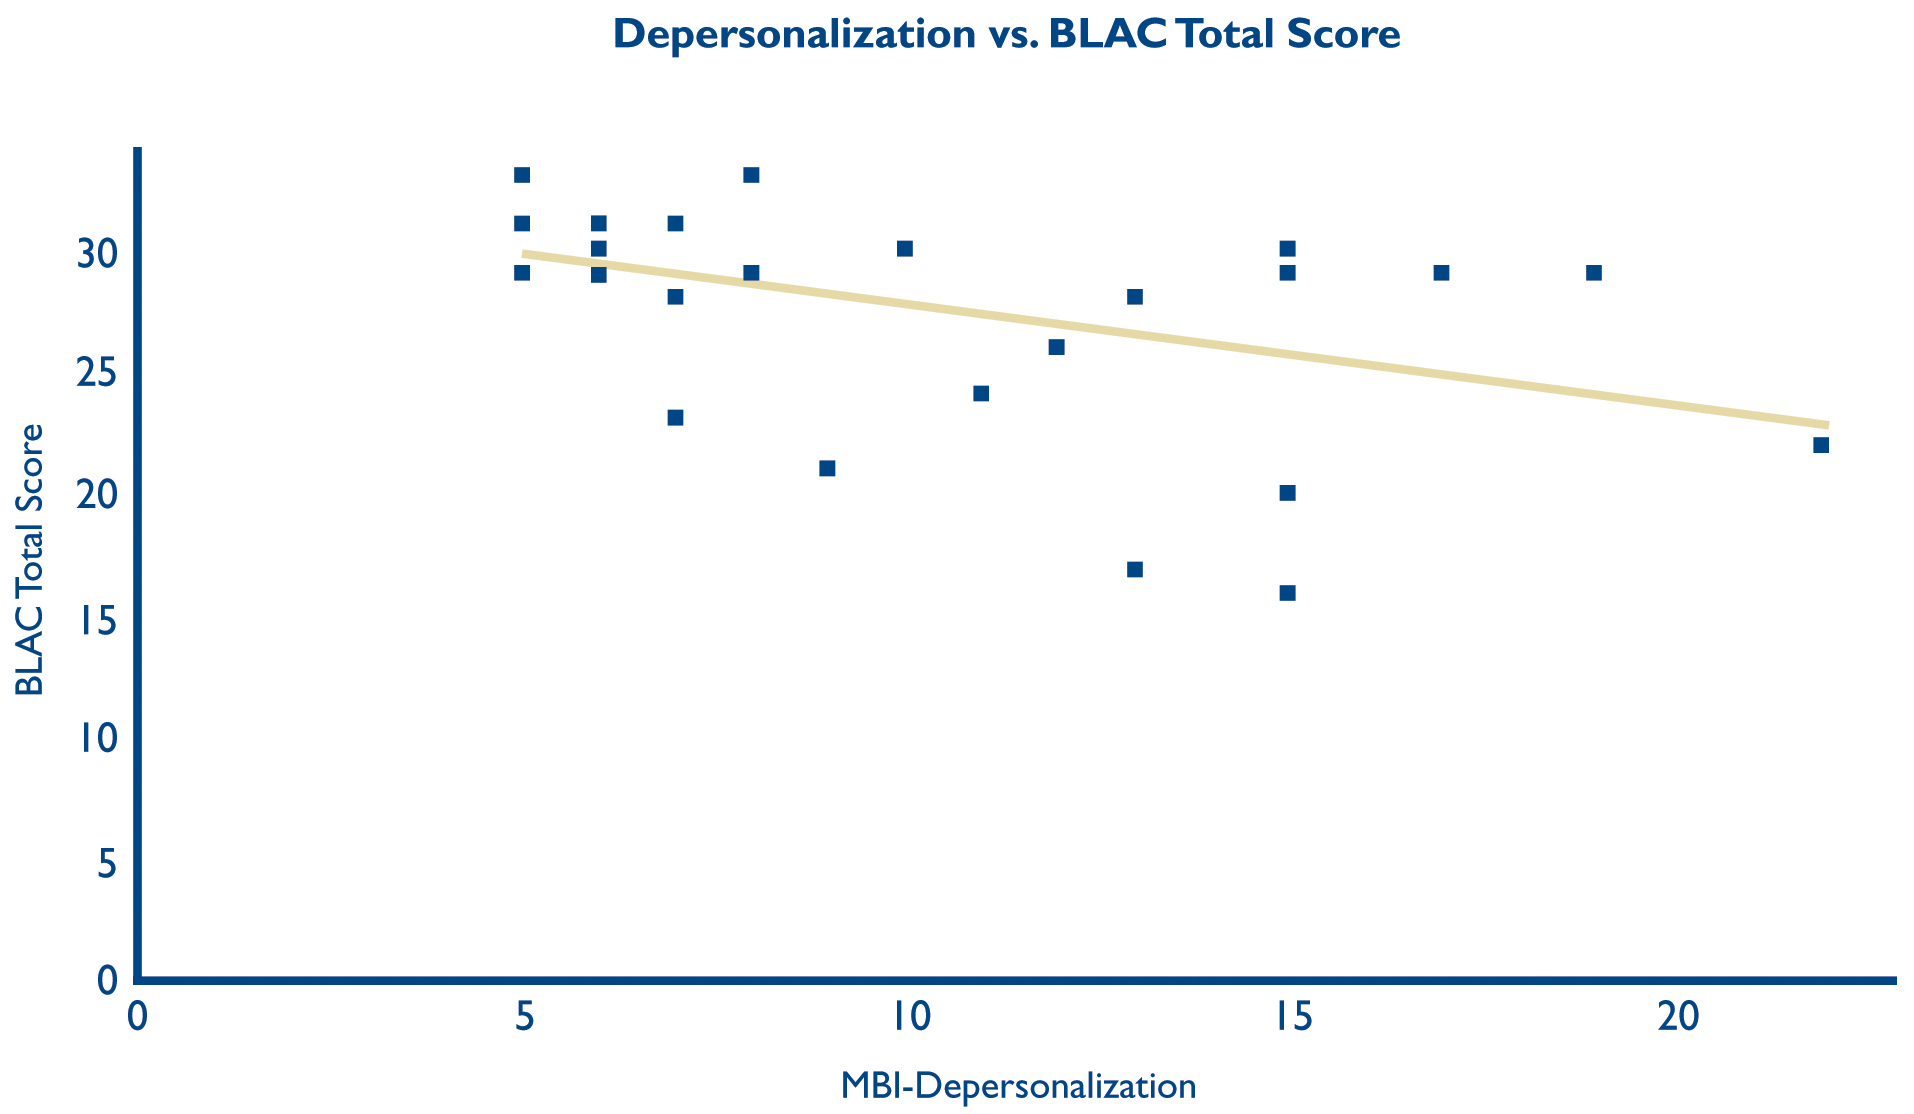
Fig. 1. Scatter plot with linear trend line of Depersonalization, as measured by the Maslach Burnout Inventory, and cloudiness, as measured by the Buckwalter-Lake Assessment of Cloudiness, assessed at six-month follow up. It was created using the online platform plot.ly (Plotly Technologies Inc., Montréal, Québec, 2015) on November 5, 2015.
DISCUSSION
We found a significant inverse correlation between cloudiness (assessed on the BLAC), and depersonalization (assessed on the MBI). Depersonalization is characterized by withdrawal from relationships and developing a generalized negative affect. Higher levels of depersonalization were associated with a greater likelihood of being a white cloud. We urge caution in interpreting this association, given the limited, but acceptable, reliability of the BLAC, and the lack of initial association between the BLAC and MBI domains. To our knowledge, this is the first study to evaluate the construct of the “black cloud” in relation to personality and burnout. We found no correlation between cloudiness and workload, personality, locus of control, or outpatient chart closure time. Our novel tool, the Buckwalter-Lake Assessment of Cloudiness, was found to be acceptably reliable in assessing the construct of cloudiness, but would benefit from further refinement in future studies. Furthermore, it supports the conceptualization of cloudiness as a construct that does not change over time.
6
COMPARISON WITH OTHER STUDIES
While the high prevalence of resident burnout has been reported in many studies,
13 our finding that higher levels of depersonalization on the MBI might correlate with “whiter” clouds is new. In a study of nurses in the UK, higher levels of depersonalization are associated with higher levels of acutely ill patients.
14 While our study did not show a correlation with overall workload, we did not explicitly assess the acuity of admission beyond stratifying the adult admissions as critical care and non-critical care, and obstetrical deliveries as low-risk and high risk. Our study was also not intended to assess correlates of resident burnout. Self-perception as a white cloud might be a result of a successful, but maladaptive, coping mechanism: depersonalization. Depersonalization in residents has been linked to higher levels of alcohol use, and less adequate sleep.
15 Sleep was not evaluated in our study, but a previous study identified self-reported unrefreshing sleep as correlating with being a black cloud.
5 The previous hypothesis that black clouds are inefficient was not evident in our evaluation of chart closure time and BLAC score.
Strengths
The strengths of this research relate to the number of variables evaluated for correlation with cloudiness. The population we studied worked with pediatric, obstetrical, and adult patients in both inpatient and outpatient settings, making them ideal subjects for identifying a discrete correlation between BLAC score and a certain type of workload.
Limitations
The assumption made in creating the BLAC tool is that the “black cloud” is a construct with which one self-identifies. Thus, the tool was not designed to have residents determine each other’s cloudiness. Further research could investigate the role of interpersonal labeling. Another limitation is that this assessment was performed only in one institution, in one residency. This construct may vary based on local cultures. Additionally, the BLAC was designed for the types of workload performed in our residency. We would not anticipate that a physician who does not perform deliveries, but does emergency trauma surgery would be validly assessed by the BLAC.
There was a fair amount of internal discussion among the residents prior to being able to launch the study. This anticipation by the residents may explain the difference in the MBI depersonalization association between the first and second BLAC assessments. Expecting that personality, burnout, and locus of control would be compared to cloudiness, this may have caused some regression to the mean to avoid being an outlier. Furthermore, the six-month assessment was not administered in a group setting and the discussions about our study had dissipated, which could have decreased this effect. Our limited sample size may not have identified smaller but still relevant findings. Finally, the multiple comparisons and investigational nature of our design increase the statistical risk of a Type I error. (False attribution of significance where none actually exists.) There is thus a possibility that the statistical association between depersonalization and “white clouds” is a false positive.
CONCLUSION
The correlation between depersonalization and identifying as a “white cloud” is novel, but further investigation in other settings would be appropriate, as we only found this correlation in the six-month assessment. If confirmed, this may be helpful as an additional tool, though a counterintuitive one, for identifying resident burnout.
ACKNOWLEDGEMENTS
Funding: No funding was provided for design and conduct of this study; collection, management, analysis, and interpretation of the data, nor preparation, review, and approval of this manuscript. All authors were employed by Lancaster General Health during the period of the study. The views expressed are those of the authors and not necessarily those of Lancaster General Health or Penn Medicine.
Competing interests: All authors have completed the ICMJE uniform disclosure form at www.icmje.org/coi_disclosure.pdf (available on request from the corresponding author) and declare no support from any organization for the submitted work, no financial relationships with any organizations that might have an interest in the submitted work in the previous three years and no other relationships or activities that could appear to have influenced the submitted work.
ACL (Lancaster General Health) had full access to all of the data in the study and takes responsibility for the integrity of the data and the accuracy of the data analysis.
Contributors: ACL and NAB designed this study. MH extracted the data and performed the statistical analysis.
ACL wrote the manuscript and is guarantor. We wish to thank Dr. Peggy Nepps, PhD, for her advice while designing and implementing this study.
*Both Dr. Lake and Dr. Buckwalter were family medicine residents at Lancaster General Health for the duration of the study.
**Damisch, L., Stoberock, B., & Mussweiler, T. Keep your fingers crossed! How superstition improves performance. Psychological Science, 2010; 21, 1014–1020. doi: 10.1177/0956797610372631
***Calin-Jageman RJ, Caldwell TL. Replication of the Superstition and Performance Study by Damisch, Stoberock, and Mussweiler. Soc Psych 2014; 45(3):239–245. DOI: 10.1027/1864-9335/a000190
iA full description of statistical methods is provided in the Statistical Appendix at the end of this article.
REFERENCES
1.Superstitions: Why you believe. CBS News [Internet]. 2012 October 28. [cited 2016 May 20]. Available from:
http://www.cbsnews.com/news/superstitions-why-you-believe
2.Mandell D, Claypool, M, Kay, D. Superstitions among perioperative nurses. AORN J. 2005;81(5):971-4, 977-80, 983-984.
3.Matsui T, Nakagawa M, Nagamatsu S, Kayano S, Koinumi T, Katsuragi Y. Microsurgeons are superstitious? A statistical survey by questionnaire. J Reconstr Microsurg 2010;26 (9):583-588.
4.Lim E, Oh V, Quek A, Seet RC. Take a bao if you are not superstitious. Ann Acad Med Singapore 2007;36(3):217-220.
5.Tanz RR, Charrow J. Black clouds. Work load, sleep and resident reputation. Am J Dis Child 1993;147(5):579-584.
6.Walling, H. Actual versus perceived workload for house officers: black cloud looming? Ann Intern Med 2004;140(10):847-848.
7.Roberts D, Shanafelt T, Dyrbye L, West CP. A national comparison of burnout and work-life balance among internal medicine hospitalists and outpatient general internists. J Hosp Med 2014;9(3):176-181.
8.Dyrbye L, West C, Satele D, et al. Burnout among US medical students, residents, and early career physicians relative to the general US population. Acad Med 2014;89(3):443-451.
9.Streu R, Hansen J, Abrahamse P, Alderman AK. Professional burnout among US plastic surgeons: results of a national survey. Ann Plast Surg 2014;72(3):346-350.
10.Shanafelt T, Gradishar W, Kosty M, et al. (2014). Burnout and career satisfaction among US oncologists. J Clin Oncol 2014;32(7):678-686.
11.Goubert L, Crombez G, Van Damme S. The role of neuroticism, pain catastrophizing and pain related fear in vigilance to pain: a structural equations approach. Pain 2004;107: 234-241.
12.Partlak Gunusen N, Ustun B, Erdem S. Work stress and emotional exhaustion in nurses: the mediating role of internal locus of control. Res Theory Nurs Pract 2014;28(3):260-268.
13.McClafferty H, Brown OW; Section on Integrative Medicine; Committee on Practive and Ambulatory Medicine. Physician health and wellness. Pediatrics 2014;134(4):830-835.
14.Hill RG, Ryan P, Hardy P, et al. Situational levels of burnout among staff in six European inpatient and community mental health teams.
Journal of Mental Health Workforce Development 2006;1(1):12-21.
15.Lebensohn P, Dodds S, Benn R, et al. Resident wellness behaviors: relationship to stress, depression and burnout. Fam Med 2013;45(8):541-549.
STATISTICAL APPENDIX
Overall workload was calculated as occurrences/hour of responsibility and was analyzed using z-scores for each measure of inpatient workload, as well as by creating a summary z-score for workload, for purposes of comparison. By summing workload z-scores, we created a composite total workload score. Outpatient clinic chart time-to-closure was captured via the EMR as a separate measure and the median was calculated for each resident and then was transformed using a logarithmic transformation due to the extreme outliers for some of the residents. Data were assessed for significance using univariate linear (y=bx+c) regression analysis with the BLAC score as the dependent variable and the questionnaires or workload occurrences as the independent variables. The plots of all comparisons were assessed for non-linearity as well as assessing diagnostics and residuals. We also calculated coefficient alpha for the combined baseline and six-month administration of the BLAC scale to assess reliability. Statistical software used for comparisons was Stata version 13 (College Station, TX).
Power calculations were not performed prior to initiating the study as the subjects were drawn from a convenience sample. Because of the exploratory nature of this study, and the desire to minimize type II error, adjustments were not made to the threshold of significance despite multiple comparisons, and Alpha was set to 0.05 for this study. The null hypothesis in each comparison was that no association existed. Graduating residents who were included in the first assessment were not assessed in the subsequent assessment. One resident who completed the first assessment did not complete the second assessment, and one who completed the second did not complete the first. The former was included in comparisons within the first assessments only, and the later was excluded from the analysis. Sensitivity analysis was not performed. A multivariate regression was not pursued due to low rate of significant findings in the univariate analysis.